

Dog breed popularity chart
The American Kennel Club just announced the 2018 rankings of dog breed popularity, collected from registration data in the USA.
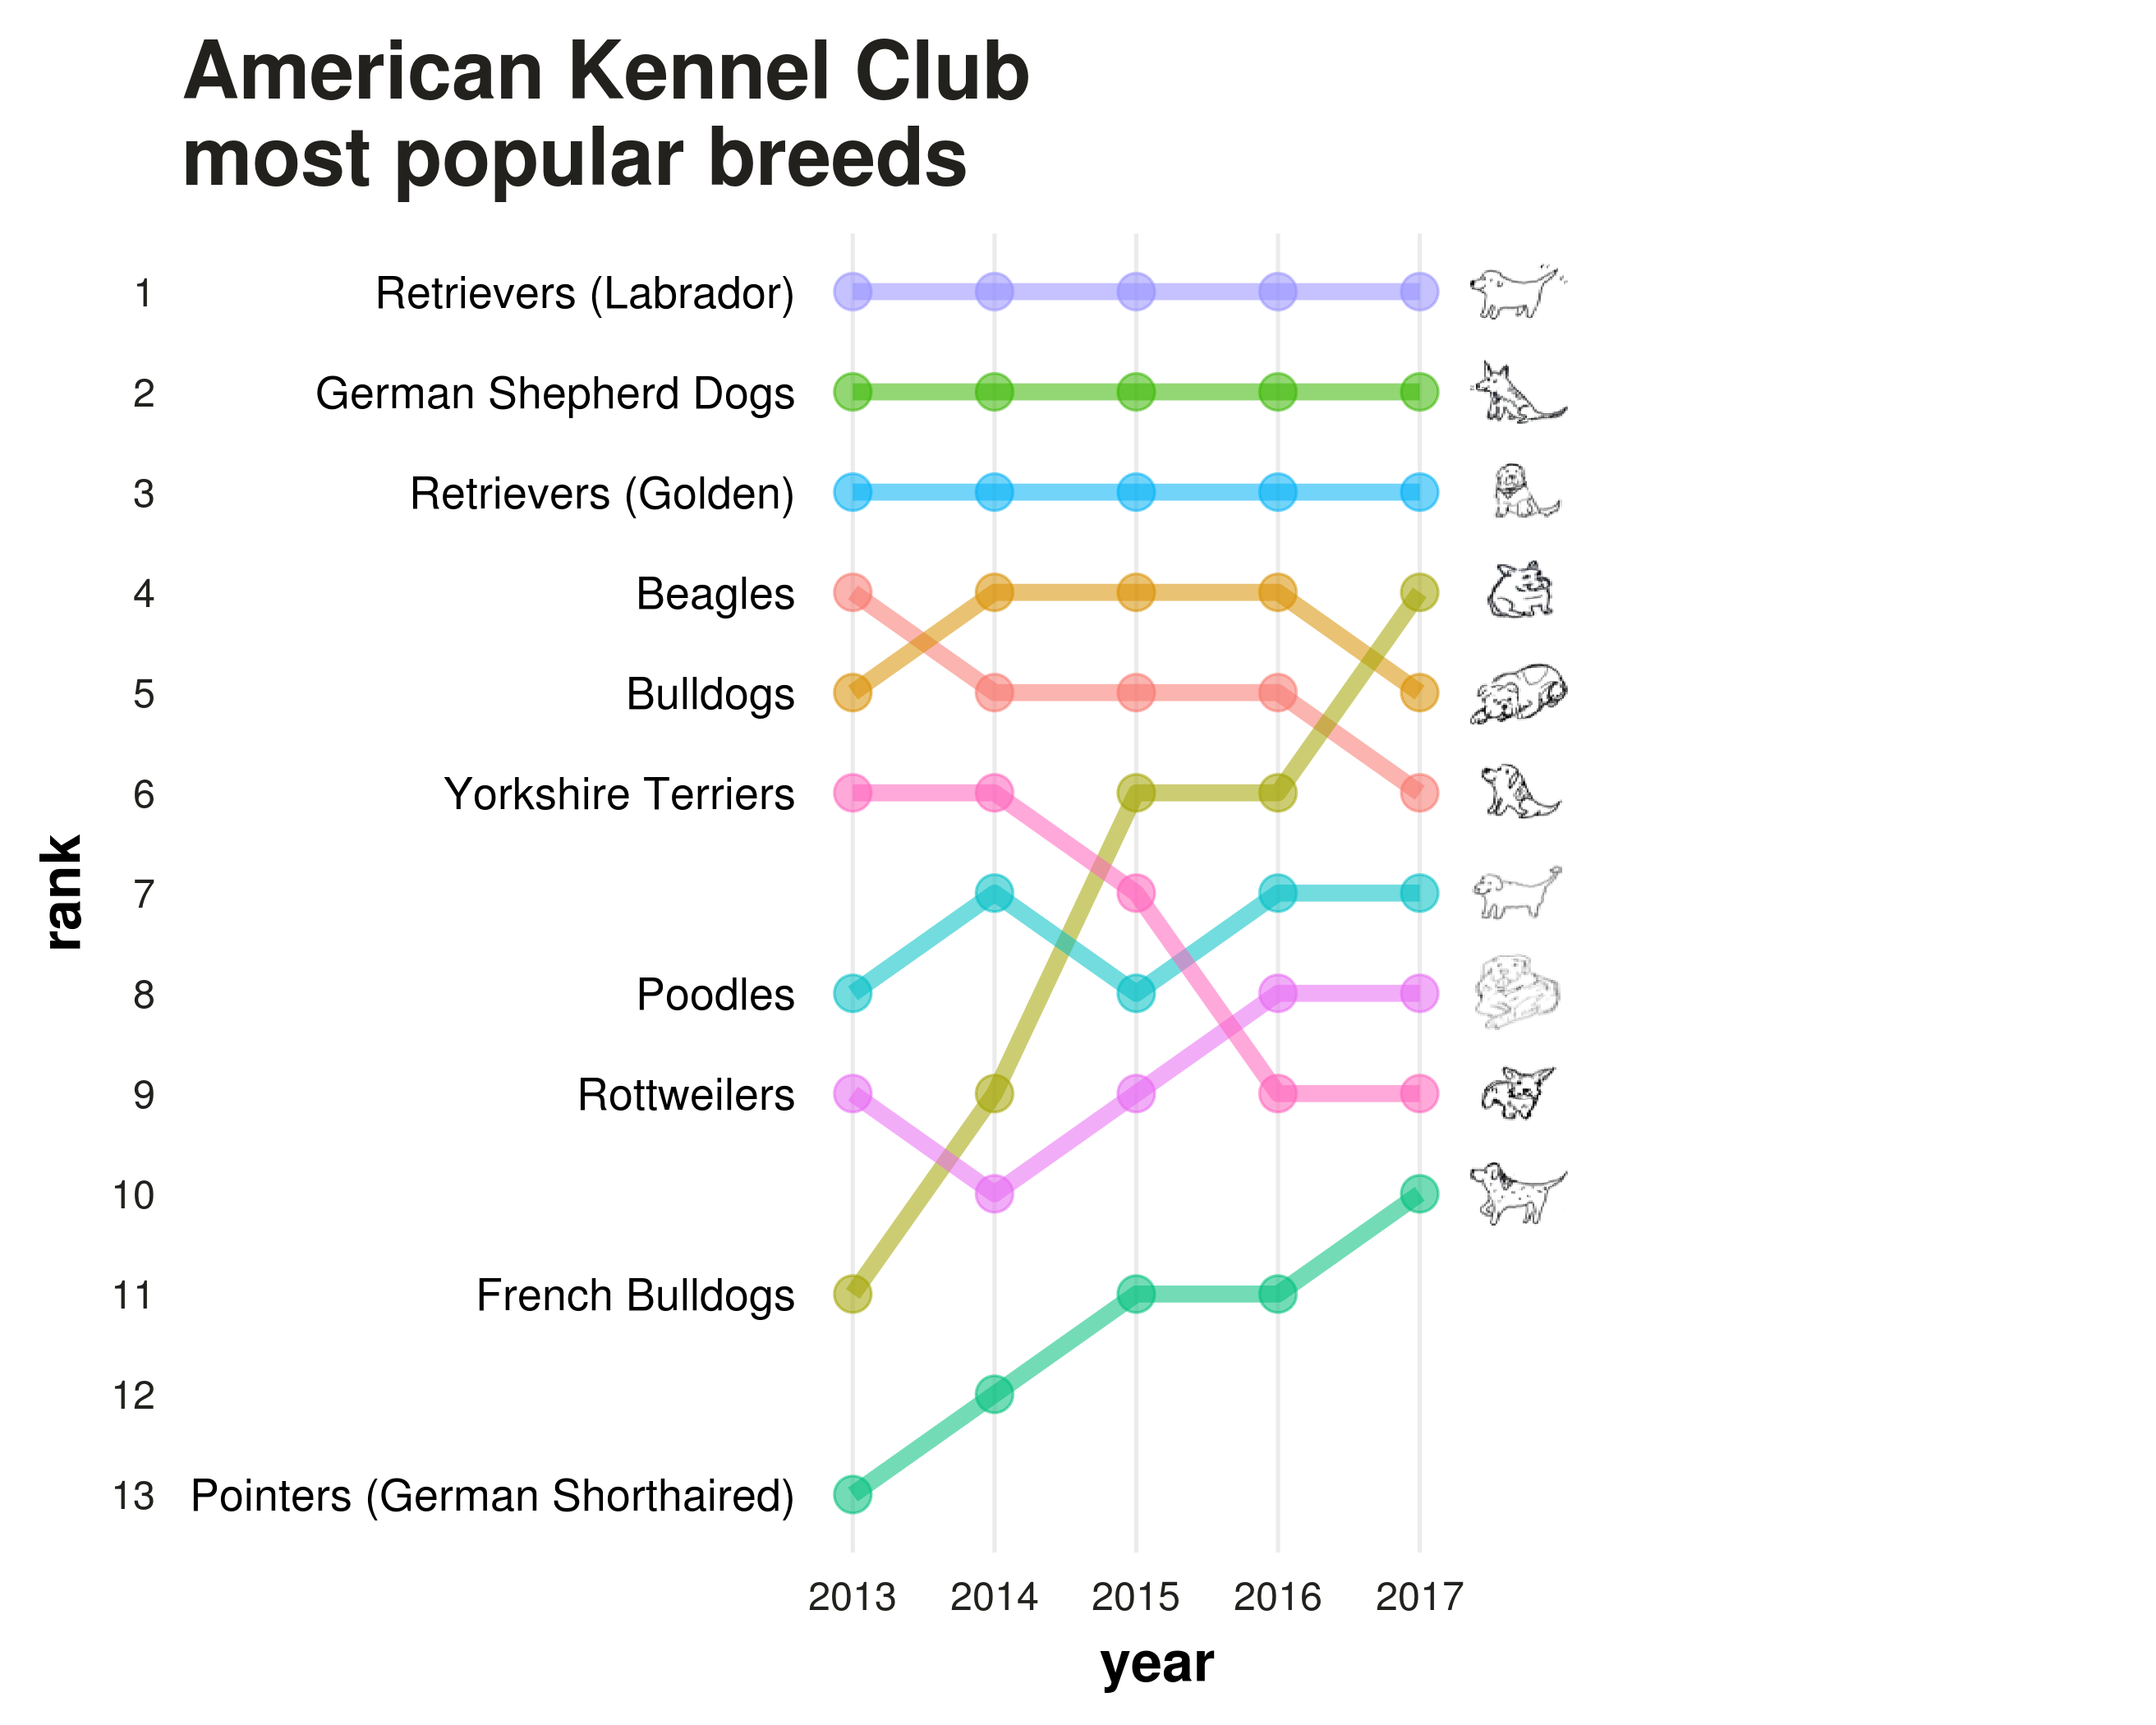
Last year, I followed this post by Dominik Koch about creating bump charts in R using ggplot2 to show changes in rank over time, and applied it to dog breed popularity rankings from 2013-2017. The resulting chart is below, and the code is detailed in this entry.
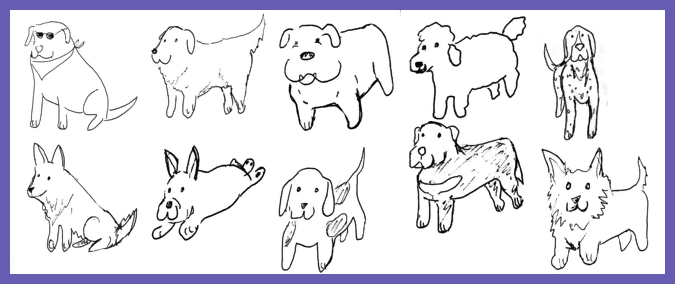
With the new rankings out, here’s a quick update to last year’s post. I drew more dogs for use as custom image labels with ggimage, and this time they are full-size pngs with transparent backgrounds, available here.
The new dog drawings look like this. I assembled the little collage using Maëlle Salmon’s magick resources.
…and here’s the updated plot:
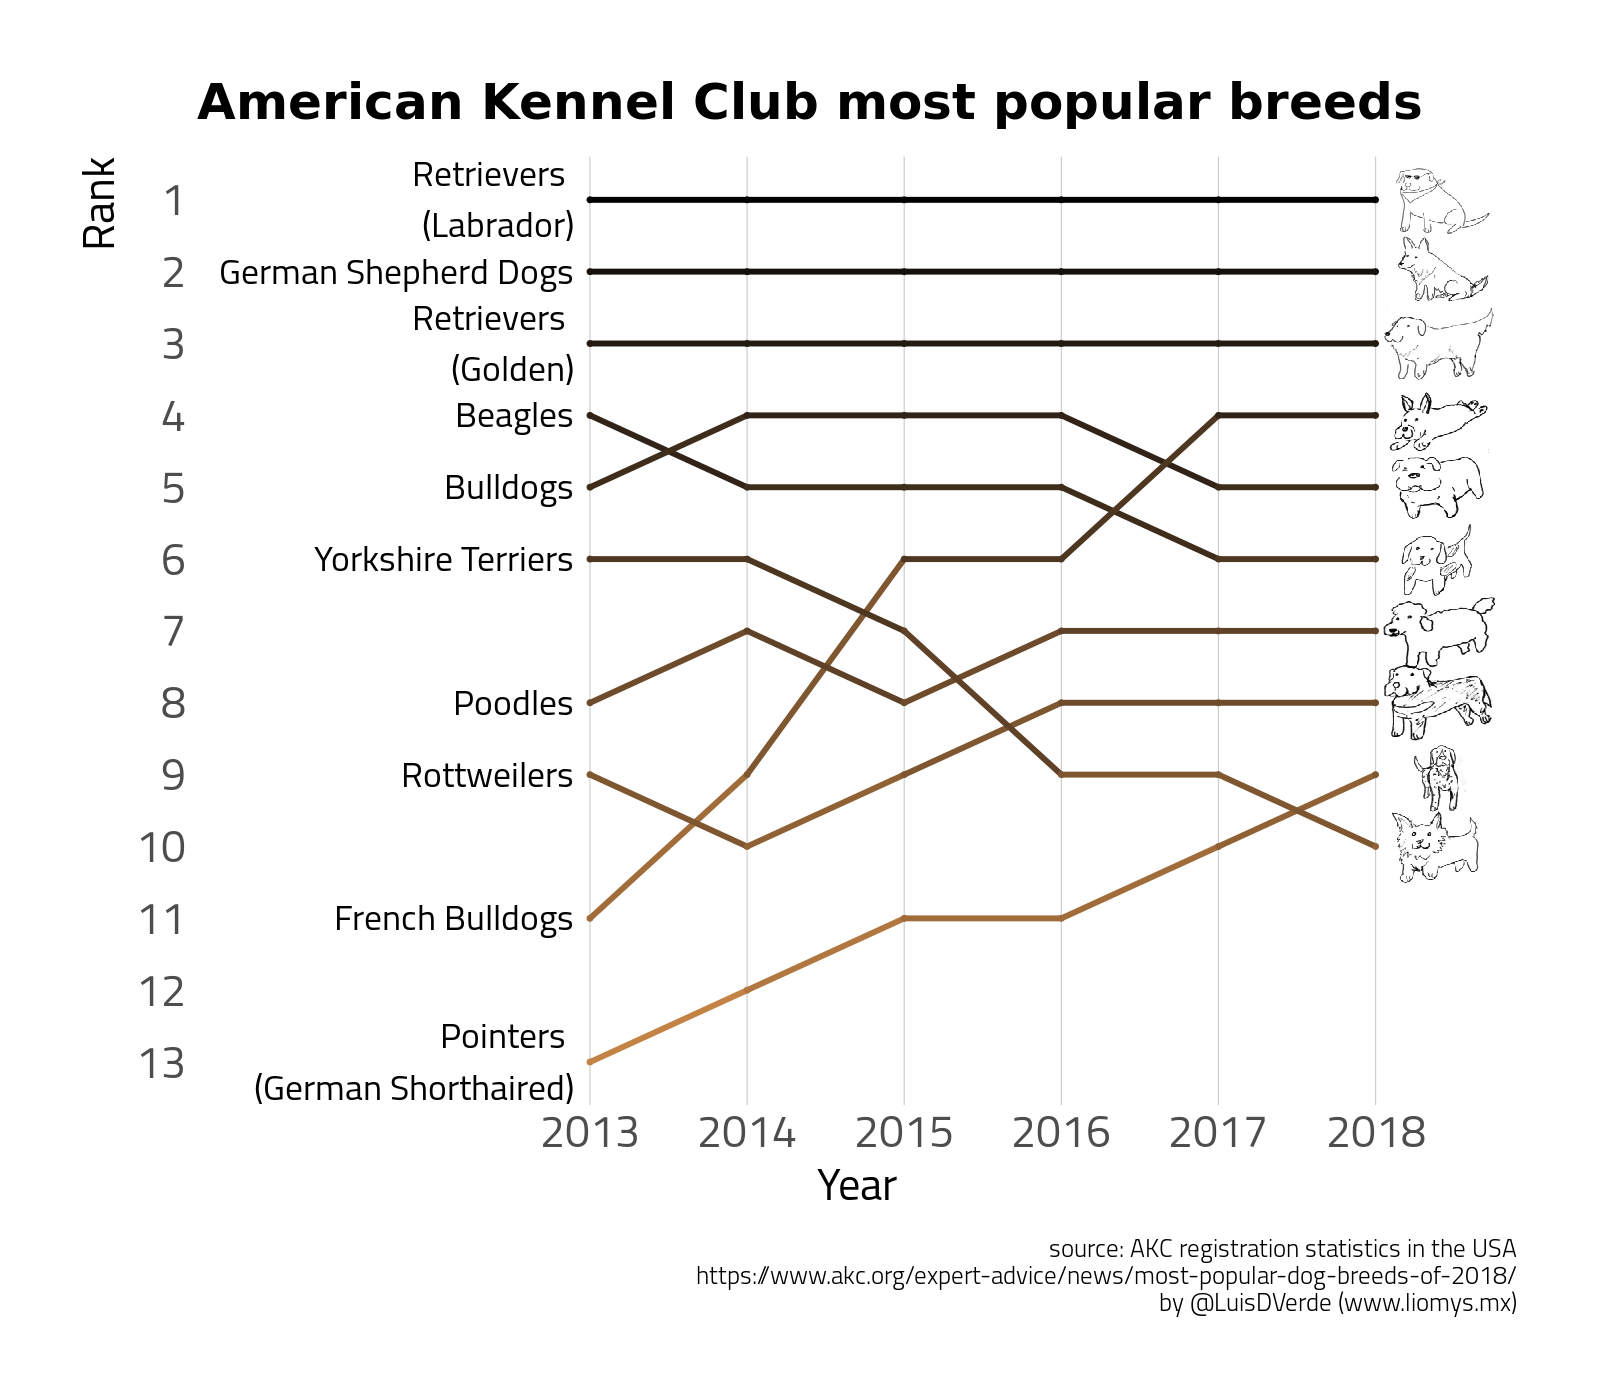
The code for the updated chart is in the gist at the end of this post. The plotting code is less fiddly and I was more careful with paths when working with the images.
Thanks for reading. Let me know if anything isn’t working and feel free to reuse the dog drawings (with attribution).
The code: