
When plotting phylogenetic trees it is often useful to collapse and/or label clades for more informative figures. ggtree can do both, and this can be very useful for drawing large trees with taxonomic context and to avoid tiny+unreadable tip labels. Here’s a brief walkthrough:
Lets use the caniform phylogeny bundled with geiger and work with genera for the labels and collapsed nodes. This example is for genera, simply obtained by splitting the scientific names at the tree tips, but we can join the tabular representation of our trees with any other data containing higher taxonomic information (tribes, families, orders, etc).
# load packages
library(ggtree)  # Bioconductor v3.10.1
library(dplyr)   # CRAN v1.1.4
library(stringr) # CRAN v1.5.1
library(geiger)  # CRAN v2.0.11

data("caniformia")
caniftree <- caniformia$phy
It is easy to split the scientific names and get the genera (or do other joins) if we work with a tabular representation of the phylo object.
canif_df <- as_tibble(caniftree)
canif_df <- canif_df %>%
  mutate(genus=str_extract(label,".*?(?=_)")) %>% # regex!
  filter(!is.na(genus)) # drops internal nodes
A few extra steps to discard monotypic genera and prepare a list of nodes needed for the next stage:
# process nodes for label placement
formrca <- canif_df %>%
  add_count(genus, name = "numnodes") %>%
  filter(numnodes>2)

# node numbers per genus
gen_nodes <-
  formrca %>%
  group_split(genus) %>%
  purrr::map(pull, node)

  # genus names
gnamesvec <- formrca %>%
  group_split(genus) %>%
  purrr::map(pull, genus) %>%
  purrr::map(unique)
Our two outputs look like this (a randomly chosen example):
> gen_nodes[3]
[[1]]
[1] 115 116 117

> gnamesvec[3]
[[1]]
[1] "Lontra"
These various wrangling steps ultimately feed a wrapper function that gets the most recent common ancestors (MRCA) for our clades of interest. I took advantage of purrr::map2 to iterate through the two lists.
# define function for getting MRCA node
getCladeNode <- function(tree, nodesvec, gname) {
  nodenum <- getMRCA(tree, tip = nodesvec)
  tibble(clade = gname, node = nodenum)
}

# table with genera and their mrca
genNodes <-
  purrr::map2_df(gen_nodes, gnamesvec,
                 ~ getCladeNode(caniftree, .x, .y)) # formula notation
The type-specific map produces this nice tibble:
> genNodes
# A tibble: 9 × 2
   node clade
  <int> <chr>
1   183 Arctocephalus
2   140 Canis
3   255 Lontra
4   224 Martes
5   236 Mustela
6   149 Pseudalopex
7   207 Pusa
8   170 Ursus
9   159 Vulpes
The tree looks like this:
canif_tree <- ggtree(caniftree,size=0.1)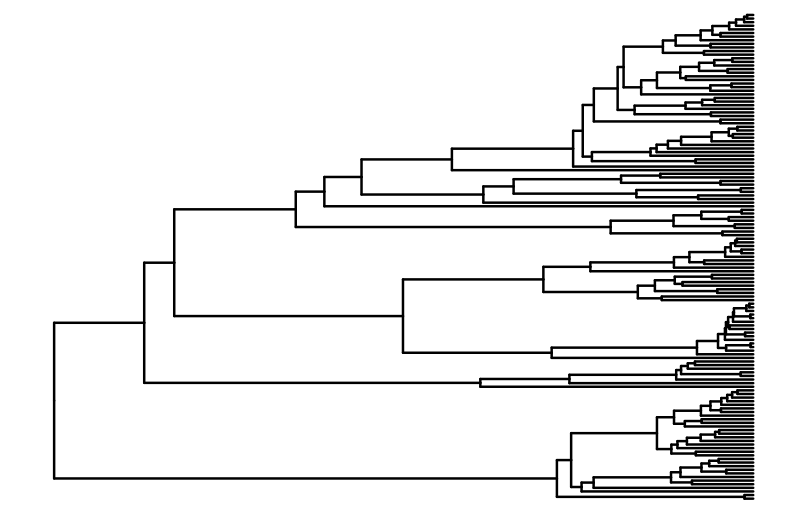
To collapse a single node in a ggtree object, the collapse() function has an argument for the node of interest, and options for how to draw the newly collapsed branches. mode = max and align = TRUE is perhaps the most popular option for this.
Node 140 is for the genus Canis.
collapse(canif_tree,node = 140,mode = "max",fill="transparent",
         color="black",size=0.1)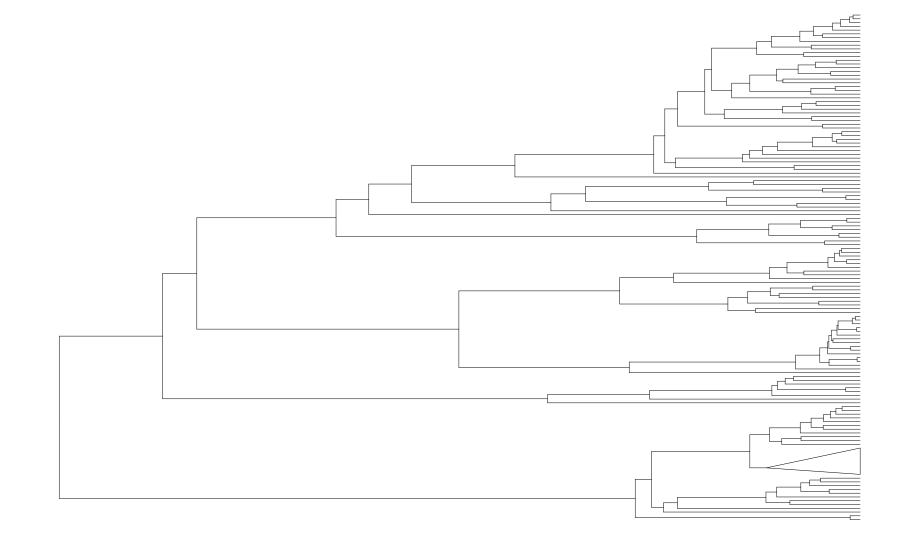
Rather than repeating this call for all the nodes of interest using for loops, let’s reduce, with the canif_tree ggtree object as the value for .init (so we collapse clades iteratively starting from here).
The syntax can be confusing at first but I learned how to use reduce with these two posts, by June Choe:
and Maëlle Salmon:
collapsed_tree <-
  purrr::reduce(
    genNodes$node,
    \(x,y) collapse(x,y,mode = "max",fill="transparent",
                    color="black",size=0.1,),
    .init = canif_tree
  )
collapsed_tree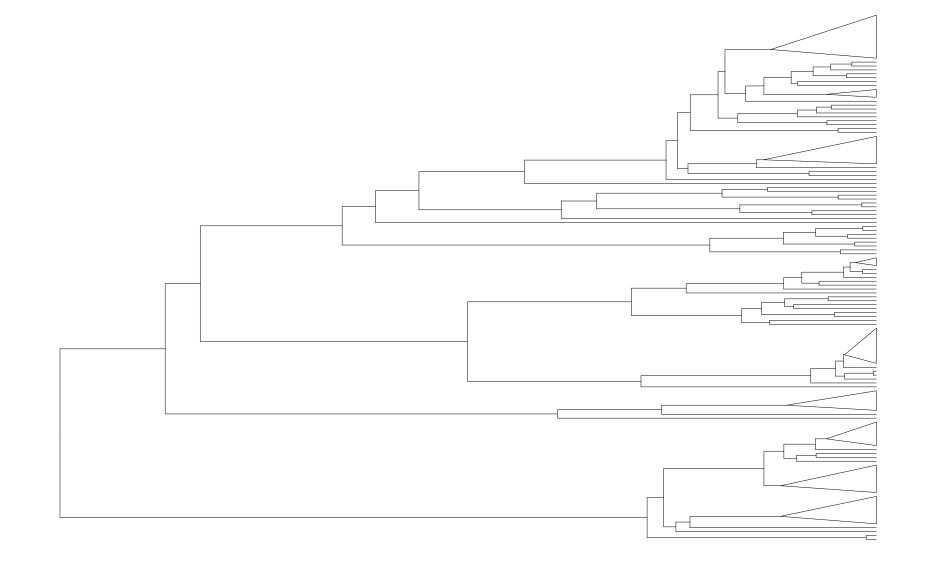
If we want to label the genera using geom_cladelab instead, we can use reduce2 and some nice anonymous formula notation. After that add some minor tweaks to the space to let the labels show.
purrr::reduce2(
  genNodes$node,
  genNodes$clade,
  \(x,y,z) x + geom_cladelab(
    node=y,label=z,
    barsize = 1, offset = -1,
    offset.text = 0.1,
    vjust = 0,
    align= TRUE,
    fontsize = 3
  ),
  .init = canif_tree
) + hexpand(3, direction = 1)+xlim(c(0,60))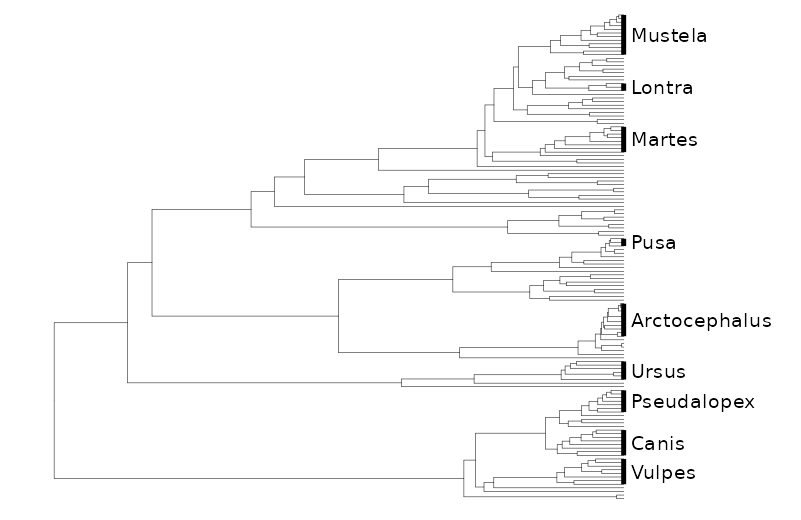
It is also possible to label a collapsed tree in the same way but the output seems off (the bars do not show up no matter what I’ve tried and the label allignment seems to be relative to the max node so it does not look too centered to me).
purrr::reduce2(
  genNodes$node,
  genNodes$clade,
  \(x,y,z) x + geom_cladelab(
    node=y,label=z,
    barsize = 1, offset = -1,
    offset.text = 0.1,
    vjust = 0,
    align= TRUE,
    fontsize = 3
  ),
  .init = collapsed_tree
) + hexpand(3, direction = 1)+xlim(c(0,60))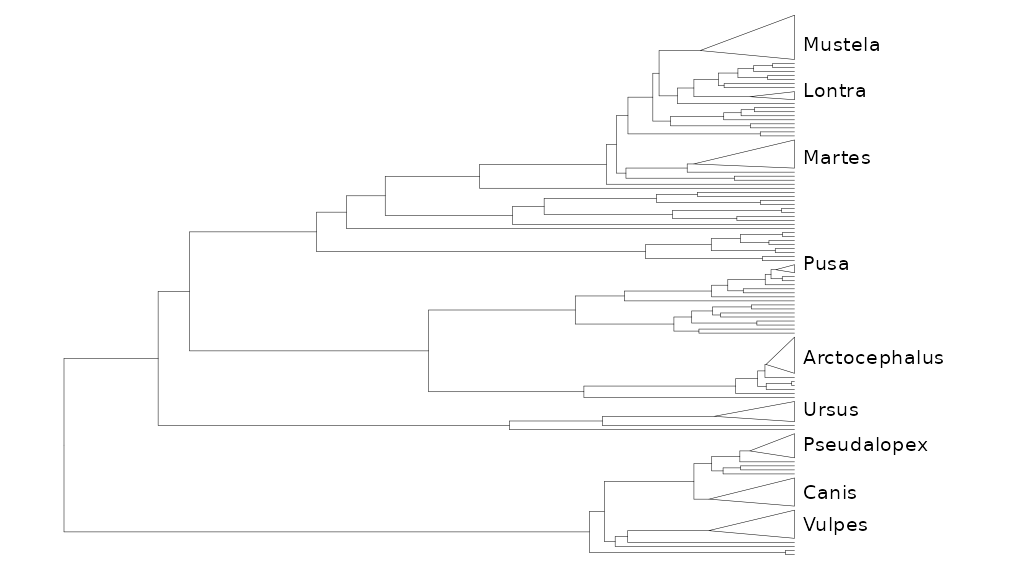
Hope this helps!