

This is what happens when you encode data as cell formatting in Excel
I recently offered to help create the game cards for a mammalogy-themed trivia board game that will be made available later in the year. The questions and answers had already been prepared and they were stored in an Excel file.
When it was first described to me, the data structure seemed sensible:
- one worksheet per topic
- one row per question, followed by the possible answers on the same row
All I had to do was wrangle the questions and answers into little tables with one question from each topic and put them in MS Word documents that would then be given to a graphic designer at the print shop.
Everything seemed fine, until I opened the spreadsheet and realized that the correct answers were highlighted in bold, and the position of the correct answer for each question was already randomized. I’ve written about not using formatting this way (and so have many others before me, see here) , but I personally hadn’t had to deal with this kind of dataset before.

For this post I’ll walk through a brief example using multiple choice questions derived from these trivia pages. For two different topics, I’ve organized two questions per topic into an Excel file similar to the one I worked with.
A multiple choice question with its answers would typically look like this:
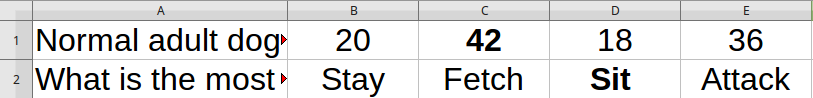
- Normal adult dogs have how many teeth?
A) 20
B) 42
C) 18
D) 36
The correct answer (42) is highlighted with bold font. In the Excel format I was dealing with, the same question looks like this (the one on the first row):
Getting the data into R
Thanks to the hard work of Jenny Bryan and the tidyverse team, reading Excel files into R with readxl is easy, and we can even use purrr to read multiple worksheets at once.
However, before importing anything, let’s consider:
- formatting in a spreadsheet cell does not carry over to values in a data frame
- behind the cells we see in Excel spreadsheets there are compressed XML markup files
This sums it up nicely..
This is your spreadsheet.
— Jenny Bryan (@JennyBryan) February 20, 2016
This is your spreadsheet on XML. #rstats pic.twitter.com/yzRahnEBO9
Having the correct answer randomized and identified only through cell formatting had me stumped for days, but some web searches led me to this tweet and onto the tidyxl package.
When your spreadsheet is too 😱😩😡 for readxl, tidyxl + unpivotr helps you tackle charming features like “data as formatting” and “data in the layout”. https://t.co/ABerpfHT8W
— Jenny Bryan (@JennyBryan) December 7, 2017
Let’s see how we can tackle mutli-sheet Excel files that use formatting to convey information.
Getting started
To follow along, download this xlsx file to your working directory.
First, we iterate through the sheets to get a single data frame with all the questions and answers, labeled according to their topic.
# load packages
library(readxl)
library(tidyxl)
library(dplyr)
library(purrr)
library(tidyr)


# path to spreadsheet
file <- "exclread.xlsx"
# get sheet names
sheets <- excel_sheets("exclread.xlsx")

# read rectangular
all_sheets <-
  file %>%
  excel_sheets() %>%
  set_names() %>%
  map(read_excel, path = file,col_names = FALSE,col_types = "text")

# label each DF with categories, bind rows, add numbering, rename vars,
all_qs_lab <-
all_sheets %>% map2(names(all_sheets),~mutate(.x,name=.y)) %>%
  reduce(rbind) %>% tibble::rowid_to_column()%>%
  select(question_number=1,question=2,a=3,b=4,c=5,d=6,category=7) %>%
  select(question,everything()) %>%
  group_by(category) %>% mutate(bycat_number = row_number()) %>% ungroup
The resulting tibble has everything we need, but we lost the correct answers when we lost the formatting.
# A tibble: 4 x 8
  question               question_number a      b      c        d     category bycat_number
  <chr>                            <int> <chr>  <chr>  <chr>    <chr> <chr>           <int>
1 Normal adult dogs hav…               1 20     42     18       36    dogs                1
2 What is the most comm…               2 Stay   Fetch  Sit      Atta… dogs                2
3 How many claws do hou…               3 18     16     11       14    cats                1
4 Which cat breed does …               4 Persi… Siame… Weird h… Manx  cats                2
Now, let’s check out the power of tidyxl. The package functions expose cell content, position, formatting, and comments in a tidy structure for further manipulation. The package has excellent documentation, and I referred to the free online cookbook Spreadsheet Munging Strategies by tidyxl maintainer Duncan Garmonsway.
We can use tidyxl to get the local formatting for each cell, and use some indexing to figure out which of our values represent the correct answers.
# sort out formatting
all_cells <- xlsx_cells(file,sheets = NA) %>% filter(is_blank!=TRUE)
formats <- xlsx_formats(file)
# vector of boldface
isBold <- formats[["local"]][["font"]][["bold"]]

# df of correct answers
correct_answers <- all_cells[all_cells$local_format_id %in% which(isBold),
                 c("sheet","row","character","numeric")]

# merge cell types (character and numeric)
correct_answers$boldanswer <-
  ifelse(is.na(correct_answers$character),
         yes = correct_answers$numeric, no= correct_answers$character )
correct_answers <- correct_answers %>% select(-character,-numeric) %>% tibble::rowid_to_column()
We now have a little tibble with the correct answer for each question.
> correct_answers
# A tibble: 4 x 4
  rowid sheet   row boldanswer
  <int> <chr> <int> <chr>
1     1 dogs      1 42
2     2 dogs      2 Sit
3     3 cats      1 18
4     4 cats      2 Manx
Once we know which of the possible answers for each question is the correct one, we can merge this data with a tidier, reshaped version of the question/answer data and ultimately create have a logical variable that indicates which is the correct answer. This follows the recommendation by Broman and Woo (2017) of using indicator variables instead of using formatting as a way to store information.
### melt wide to long
all_qs_lab_long <- all_qs_lab %>% gather(option_letter,answer,3:6) %>% arrange(question_number)

# join wrangled data with correct answers
all_QA <-
  left_join(all_qs_lab_long,correct_answers,by=c("bycat_number"="row","category"="sheet"))
# cleanup
all_QA <- all_QA %>% mutate_all(stringi::stri_trim_both)
# match correct answers with all possible answers to get a logical variable
all_QA <- all_QA %>% mutate(bold=if_else(answer==boldanswer,TRUE,FALSE)) %>% select(-boldanswer,-rowid)
Let’s see
> head(all_QA)
# A tibble: 6 x 7
  question                 question_number category bycat_number option_letter answer bold
  <chr>                    <chr>           <chr>    <chr>        <chr>         <chr>  <lgl>
1 Normal adult dogs have … 1               dogs     1            a             20     FALSE
2 Normal adult dogs have … 1               dogs     1            b             42     TRUE
3 Normal adult dogs have … 1               dogs     1            c             18     FALSE
4 Normal adult dogs have … 1               dogs     1            d             36     FALSE
5 What is the most common… 2               dogs     2            a             Stay   FALSE
6 What is the most common… 2               dogs     2            b             Fetch  FALSE
This data structure is more flexible and ready for whatever we need to do to create game cards, quizzes, school exams, etc.
I was specifically asked to output the questions and answers to a Word document, keeping the bold formatting as the indicator of each correct answer. To encode this information, we can wrap asterisks conditionally around the correct answers for markdown formatting (thanks to Hao Ye for the suggestion!).
# confer formatting
all_QA_Form <-
  all_QA %>% mutate(answer=if_else(bold==TRUE,paste0("**",answer,"**"),answer)) %>%
  select(-bold)
Resulting in:
> head(all_QA_Form,n = 4)
# A tibble: 4 x 6
  question                       question_number category bycat_number option_letter answer
  <chr>                          <chr>           <chr>    <chr>        <chr>         <chr>
1 Normal adult dogs have how ma… 1               dogs     1            a             20
2 Normal adult dogs have how ma… 1               dogs     1            b             **42**
3 Normal adult dogs have how ma… 1               dogs     1            c             18
4 Normal adult dogs have how ma… 1               dogs     1            d             36
At this point we can reshape the tibble again so that it resembles the original format in the Excel file. It took me a while to figure everything out, and it seems like a lot of work, but I really wanted to share this workflow and publicly thank the maintainers of all the libraries that make this possible.
# reshape
all_QA_Form_wide <-
  all_QA_Form %>% spread(key = option_letter, value = answer) %>% arrange(question_number)
Back to the original structure.
> all_QA_Form_wide
# A tibble: 4 x 8
  question               question_number category bycat_number a      b      c        d
  <chr>                  <chr>           <chr>    <chr>        <chr>  <chr>  <chr>    <chr>
1 Normal adult dogs hav… 1               dogs     1            20     **42** 18       36
2 What is the most comm… 2               dogs     2            Stay   Fetch  **Sit**  Atta…
3 How many claws do hou… 3               cats     1            **18** 16     11       14
4 Which cat breed does … 4               cats     2            Persi… Siame… Weird h… **Ma…
The original aim was to iterate through the Excel file and output human-readable questions and answers with numbered questions and itemized answers. For this, we can use the following code to prepare the data and ultimately stack everything into a single column, add grouping variables, and finally walk through the groups with purrr, purrrlyr, and knitr.
The cool/hacky part here was to stack the rows using matrix() and t().
# prepare data for stacking into a single column df
forStack <- all_QA_Form_wide %>% select(-question_number,-bycat_number)
forStack <- forStack %>% select(category,everything()) %>% arrange(category)
# unite answers
forStack <- forStack %>% unite(answers,c("a","b","c","d"), sep = ", ")
# count the number of topics
ntopics <- length(unique(forStack$category))
# how many q's of each category (should be the same for all categories anyway)
nquestions <- forStack %>% count(category) %>% pluck(2,1)
# number the q's
forStack <-  forStack %>% mutate(num_q=rep(1:ntopics,each=nquestions,times=1)) %>%
  unite(question,num_q,question,sep=". ")

# stack wide
stacked <-
  data.frame(values=matrix(t(forStack)))

# total number of cards
# each question takes up three rows (topic, question,answers)
ncards <- nrow(stacked)/((3*nquestions))

# groups for each question (3 is the number of rows per question)
stacked <- stacked %>% mutate(card=rep(1:ncards,each=3,times=ntopics))
With a grouping variable for card numbers, we end up with the questions from the different topics intercallated.
> head(stacked,9)
                                           values card
1                                            cats    1
2           1. How many claws do house cats have?    1
3                              **18**, 16, 11, 14    1
4                                            cats    2
5        1. Which cat breed does not have a tail?    2
6 Persian, Siamese, Weird hairless cats, **Manx**    2
7                                            dogs    1
8       2. Normal adult dogs have how many teeth?    1
9                              20, **42**, 18, 36    1
We won’t be generating separate output files for printing game cards, but the Question/Answers below come directly from the stacked data. For this step we’ll be using purrrlyr and knitr.
library(purrrlyr)
library(knitr)

# list of kables
Question_kables <-
  stacked  %>%
  slice_rows(c("card")) %>%
  by_slice(kable,caption=NULL,col.names="")
# print each element
Question_kables %>% walk(print)
I simply copied and pasted the output. With this code, we won’t have to copy and paste manually the hundreds of questions across six different topics in the actual production file for the board game.
[[1]]
| cats |
| 1. How many claws do house cats have? |
| 18, 16, 11, 14 |
| dogs |
| 2. Normal adult dogs have how many teeth? |
| 20, 42, 18, 36 |
[[2]]
| cats |
| 1. Which cat breed does not have a tail? |
| Persian, Siamese, Weird hairless cats, Manx |
| dogs |
| 2. What is the most common training command taught to dogs? |
| Stay, Fetch, Sit, Attack |
I hope you found this post useful. Once again, I want to thank the teams and developers that brought us readxl and tidyxl, and also Maëlle Salmon, Ken Butler, and Achim Zeileis for their inputs via Twitter. Achim even provided some custom code to plug the tidy question/answer data into the rexams package. Check it out below:
## source data frame
— Achim Zeileis (@AchimZeileis) April 18, 2018
df <- data.frame(
question = "How many beaver species are there?",
category = "mammals",
answer = c(2, 7, 10),
correct = c("T", "F", "F"),
stringsAsFactors = FALSE
)
## destination file
f <- paste0(df$category[1], ".Rmd")
## -> Markdown template