

Shot distances and court locations for NBA games
Here’s a follow up to my previous post about using nbastatr and gganimate to visualize a player’s shots throughout an NBA game.
Mara Averick shared the post, and combined two gifs side by side for the tweet.
🏀 nbastatR × gganimate w/ code!
— Mara Averick (@dataandme) January 7, 2019
"Animate shot distances for NBA games" ⛹️♂️ @LuisDVerdehttps://t.co/qP8hojEEHa #rstats #dataviz
/* L·R panels combined by me bc I hate how Twitter does tall gifs */ pic.twitter.com/9Tv8RSlAME
I had been playing with the short chart location data anyway, and the idea of having synced-up side by side animations seemed interesting.
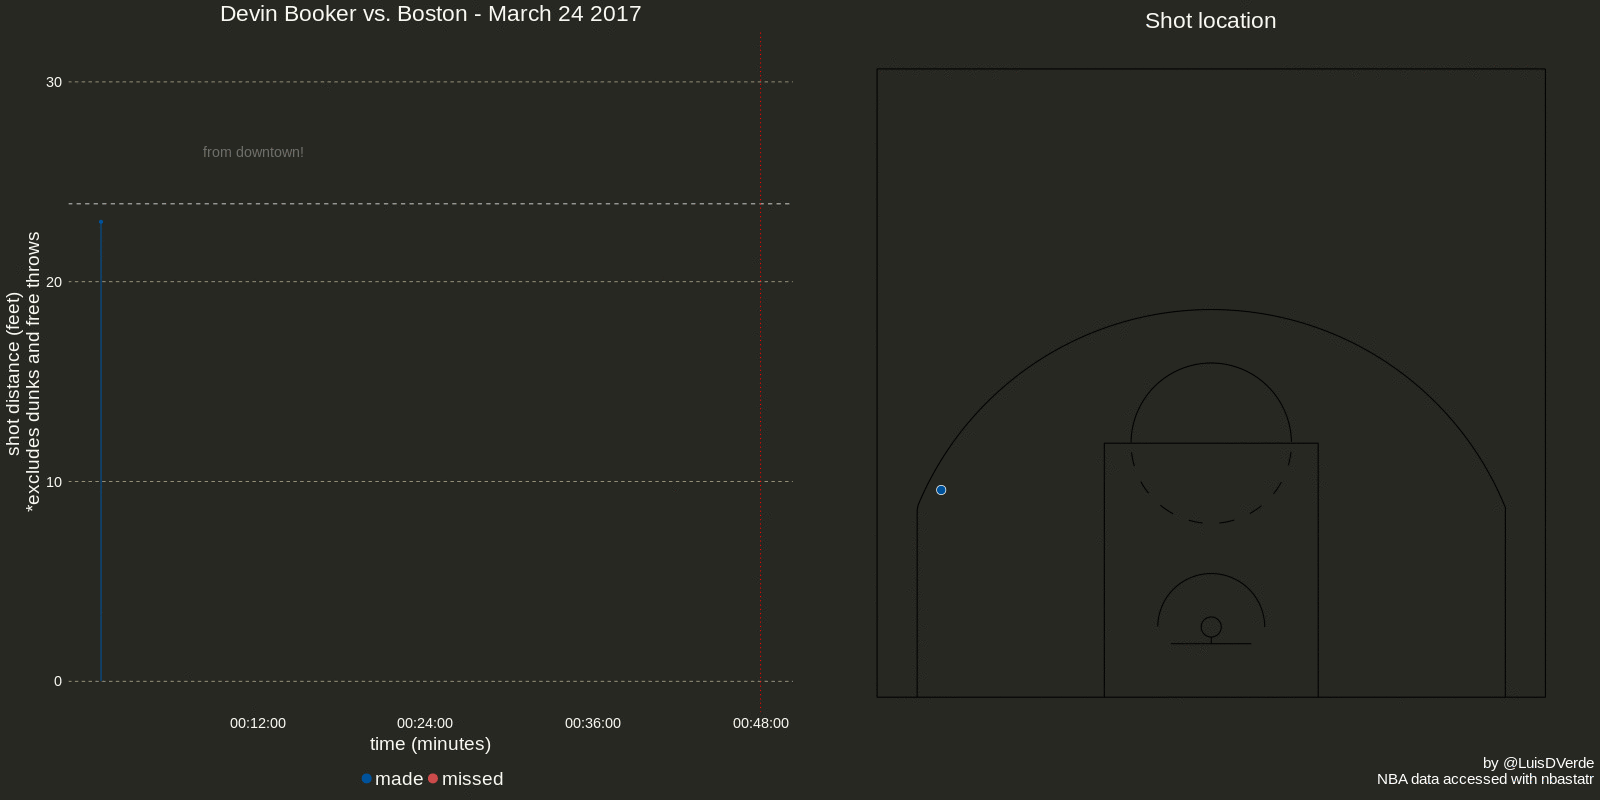
The code in the gist below should be fully reproducible. First, we can use the same approach as in my previous post to plot the shot distances over game time. Then, plotting the XY shot locations is pretty straightforward. To show the shots on the court, we can borrow some functions from the ballr Shiny app by Todd Schneider and draw the court directly in ggplot. Finally, two gifs can be put side by using magick. I found a nice function written by Patrick Toche to ease this along.
The animations were both rendered with default values, and I didn’t need to resort to any cheap hacks to get the plots to look like I intented them to :)
Shot distances and locations
Here’s Devin Booker’s 70 point game from 2017.
The code:
Keep ballin’