
Science Is Global
Tweet data and emoji flags in R
On the occasion of the ESOF (EuroScience Open Forum) conference in Manchester, The Royal Society published a joint statement from various scientific societies across Europe about the importance of International science and research collaborations, and how “unnecessary barriers to mobility will weaken science and be to the cost of all nations”. This statement included a call for people to use the social media hashtag #ScienceIsGlobal to recognize the international nature of research teams.
Our joint academies’ statement on the importance of international research #ScienceIsGlobal (1/4) pic.twitter.com/LFsSotfeW7
— The Royal Society (@royalsociety) July 25, 2016
The hashtag really took off, and in a Tweet from August 1st the Royal Society posted that #ScienceIsGlobal had reached over 10 million people across the world. Lots of people started sharing the different countries of the people in their labs or collaborative networks, mainly by using emoji flags or photos of the research teams actually holding their national flags.
A few days later, Bastian Greshake published this really cool blog post in which he analysed tweet data relating to the hashtag. To make a network chart and a chord diagram of the connections between different countries, he set up an archiver add-on to collect tweets onto a Google sheet. Then he parsed the emoji flags with a Python script to create adjacency lists for visualization.
I’ve always wanted to play with Twitter data and do something similar, but in my case I wanted to do everything in R. Using the Twitter Archiver spreadsheet he organized, I downloaded a copy of the Google sheet on 8/8/2016, which included 11655 tweets that included the hashtag (I’ve been very slow with writing this post).
This is my first attempt at working with Twitter data and strings, and I want to share the process and some of the things I learned about working with strings, dates, encodings, and emojis. To replicate my version of the analysis, I suggest downloading the Google sheet and filtering everything up to “8/8/2016 9:01:04” using lubridate. The rest of the data is already on a repo and you should be able to replicate everything by copying and pasting the code.
#load libraries (install if needed)
library(stringi)
library(dplyr)

# read file for Archiver from URL
alltweets <- read.csv("https://raw.githubusercontent.com/luisDVA/codeluis/master/scienceisglobal.csv",stringsAsFactors = F,header = T)

# strip retweets
norts <- filter(alltweets, !grepl("RT @",Tweet.Text))
norts <- filter(norts, !grepl("Retweeted",Tweet.Text))

# percentage of RTs in dataset
1-nrow(norts)/nrow(alltweets)

# strip urls
norts$Tweet.Text <- stri_replace_all_regex(norts$Tweet.Text," ?(f|ht)(tp)(s?)(://)(.*)[.|/](.*)","")
# remove duplicates
norts <- norts%>%  filter(!stri_duplicated(norts$Tweet.Text))
# remove spambot tweets
norts <- filter(norts,!grepl("VOTE for me in",Tweet.Text))
I started by cleaning up the data. To avoid duplication, I removed all the retweets, the twitteR package has a function for this, but with the flat data frame we can use dplyr::filter and some basic pattern matching to remove retweets, which made up a good portion of the dataset (about 75%). Looking at the original entries, I realized that it would be a good idea to strip all URLS, then remove other duplicates and spam (e.g. dozens of tweets with spam links or requesting votes in spammy websites).
Now we can plot how many tweets were posted each day, and we see that #scienceisglobal peaked the day after the joint statement was published and then tapered off.
norts %>%  count(posted  = date(mdy_hms(norts[,1]))) %>%
  ggplot(aes(posted,n)) +
  geom_line() +
  scale_x_date(labels = date_format("%m/%d"),breaks = date_breaks("days"))+
    labs(x = "date posted",
       y = "no. of tweets")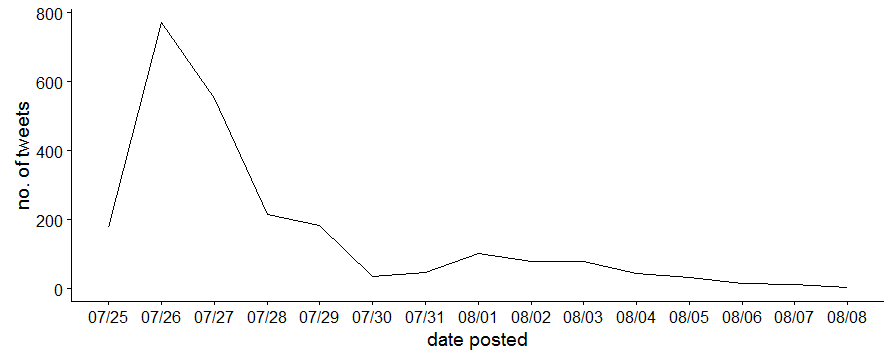
Now for the interesting part, I had to translate the flag emojis into something sensible. I don’t know if this applies to everyone, but on my Windows PC I always struggle with special characters in R. I was interested in the flag emojis people were using, and in my case I was unsure of how to deal with file encoding and fonts so all the emojis and special characters were getting “garbaged” into things like this 🇬🇧
I realized that there is no loss of information with this character garbling, and that other people also work with it (see here), so they were something I could work with. Now I could use these characters and filter our rows that won’t contain emojis.
# keep tweets with probably flags
sciFlags <- filter(norts, grepl("ð",Tweet.Text))
Emoji flags are combinations of two regional indicator letters, based on ISO 3166-1: a list of internationally recognized two-letter country codes. There are now hundreds of working flag emojis, and their indicator letters have unique encodings. Fortunately, this page has the full list, and after scraping it and doing some minor edits, I had a csv file that was getting garbaged the same way when I read it into R, making it a good translation table.
#read conversion table
emoTable2 <- read.csv("https://raw.githubusercontent.com/luisDVA/codeluis/master/countryFlags.txt",stringsAsFactors = F) %>% select("encoding"=1,"region"=2)
#add some whitespace for legibility
emoTable2$region <- paste(" ",emoTable2$region," ")
If we know what the gibberish stands for, we can use the powerful stringi package to do vectorized pattern replacements. It also helps that a similar translation table for emojis has already been put together by another team doing Twitter analytics.
I used a hacky, multi-stage process to replace flags and other emojis until all the weird characters were accounted for. The biggest issue was that there can be overlap in the character strings representing combinations of regional indicators, and because the replacements are vectorized without lookahead overlap detection, it becomes messy because countries can be both incorrectly replaced or excluded. For example, if someone mentioned Ascencion Island and Canada together (ACCA) and the vector of two-letter combinations is not ordered just right, the CC for Cocos Islands can get ‘incorrectly’ replaced instead of the two countries that were actually mentioned.
# multiple patterns and replacements
sciFlags$tweetTRANS <-  stri_replace_all_fixed(sciFlags$Tweet.Text,emoTable2$encoding,emoTable2$region,vectorize_all = F)
# filter rows that are (probably) all set
set1 <- filter(sciFlags, !grepl("ð",tweetTRANS))
# new column with tweet text that is ready to go *i.e. the column used for filtering
set1$textDone <- set1$tweetTRANS

# pending replacement
chec <- filter(sciFlags, grepl("ð",tweetTRANS))
#sad and smiley faces
emojis <- read.csv("https://raw.githubusercontent.com/luisDVA/codeluis/master/emojis.csv",stringsAsFactors = F)
emojisFilt <- filter(emojis,!grepl("flag",emojis$meaning))
# replace misc emojis
chec$transF <- stri_replace_all_fixed(chec$tweetTRANS,emojisFilt$emoji,emojisFilt$meaning,vectorize_all = F)
# extract rows that are ready to go
set2 <- filter(chec, !grepl("ð",transF))
set2$textDone <- set2$transF
# pendind more replacement
chec <- filter(chec, grepl("ð",transF))
# angry emoji replaced separately (too much overlap)
angem <- read.csv("https://raw.githubusercontent.com/luisDVA/codeluis/master/angryemoji.csv",stringsAsFactors = F)
chec$transF <-  stri_replace_all_fixed(chec$transF,angem$emoji,angem$meaning,vectorize_all = F)

# extract rows that are ready to go
set3 <- filter(chec, !grepl("ð",transF))
set3$textDone <- set3$transF
# still pending
chec <- filter(chec, grepl("ð",transF))
My solution for the overlapping patterns was to strip away all alphanumeric characters and punctuation, and to then split the remaining strings into 8-character chunks (because I realized that each regional indicator gets garbaged into four character sequences) and then translate again.
# for stubborn ones with overlaps
#strip alhpanumeric chars
chec$transStripped <- stri_replace_all_regex(chec$Tweet.Text,"[A-Za-z0-9\\s]","")
# strip left over not-so-special characters
chec$transStripped <- stri_replace_all_fixed(chec$transStripped,c("@","!","#","_",".","&","-","?",";",
                                                                  "'","/",":",",","(",")"),"",vectorize_all = F)
# split into 8 char blocks
chec$transStripped <- gsub("(.{8})", "\\1 ", chec$transStripped)
# translate with flag table
chec$countries <-  stri_replace_all_fixed(chec$transStripped,emoTable2$encoding,emoTable2$region,vectorize_all = F)

# extract rows that are ready to go
set4 <- filter(chec, !grepl("ð",countries))
set4$textDone <- set4$countries

#filter again
chec <- filter(chec, grepl("ð",countries))

#loose ends (random regional symbol emojis tweeted by people for some reason)
regsimbols <- read.csv("looseEnds.csv",stringsAsFactors = F)
# on the first translation column to avoid overlaps or unnecessary countries
chec$transF <- stri_replace_all_fixed(chec$transF,regsimbols$ï..emoji,regsimbols$meaning,vectorize_all = F)

# extract rows that are ready to go
set5 <- filter(chec, !grepl("ð",transF))
set5$textDone <- set5$transF
# filter once more
chec <- filter(chec, grepl("ð",transF))

# have them all?
nrow(set1)+nrow(set2)+nrow(set3)+nrow(set4)+nrow(set5) == nrow(sciFlags)
# bind them
Flagstranslated <- bind_rows(set1,set2,set3,set4,set5)
After that, I used stringi to extract the occurrences of different country names in each tweet and some more list manipulation to end up with a matrix of the presence of each country in each tweet. Don’t mind the for loop.
# get the country names from the tweets
countryExtract <- list()
for (i in 1:nrow(emoTable2)) {
  countryExtract[[i]] <- stri_extract_all_fixed(Flagstranslated$textDone,emoTable2$region[i],
                                                case_insensitive=TRUE,overlap=TRUE)
}

# put into DF
countryMatches <- simplify2array(countryExtract) %>% as.data.frame()

# cant remember how to apply properly
countryNs <- countryMatches
for (i in 1:ncol(countryMatches)) {
  countryNs[,i] <- sapply(countryMatches[,i],function(x)length(x[!is.na(x)]))
}

# country names without the whitespace
emoTable2$regionTrimmed <- stri_trim(emoTable2$region)
names(countryNs) <- emoTable2$regionTrimmed

# change all non cero values to 1
countryNstandard <- countryNs
countryNstandard[countryNstandard>0] <- 1

# some tweets did not have countries but had other emojis, remove them
countryNstandard <- countryNstandard[rowSums(countryNstandard)!=0,]

# summary statistics
colSums(countryNstandard)
summary(rowSums(countryNstandard))

# make a DF of colsums
countryFreqs <- colSums(countryNstandard)
countryFreqsDF <- data.frame(country=names(countryFreqs),n=countryFreqs)
Quick summary statistics: On average, about nine different countries were mentioned per tweet, with a minimum of 1 and a maximum of 50 for some people having way too much fun with emoji flags.
Bastian G. noted that the usual Western, rich industrialized countries are the most frequently mentioned. We can make a lollipop plot of the top n countries with the highest number of mentions. In this case it’s 30.
# make sure to use the latest version from github, install using devtools
library(ggalt)

countryFreqsDF %>% top_n(30) %>%
  ggplot(aes(x=reorder(country,n),y=n)) + geom_lollipop(point.colour = "blue")+
  coord_flip()+theme_minimal()+xlab("Country")+ylab("Mentions")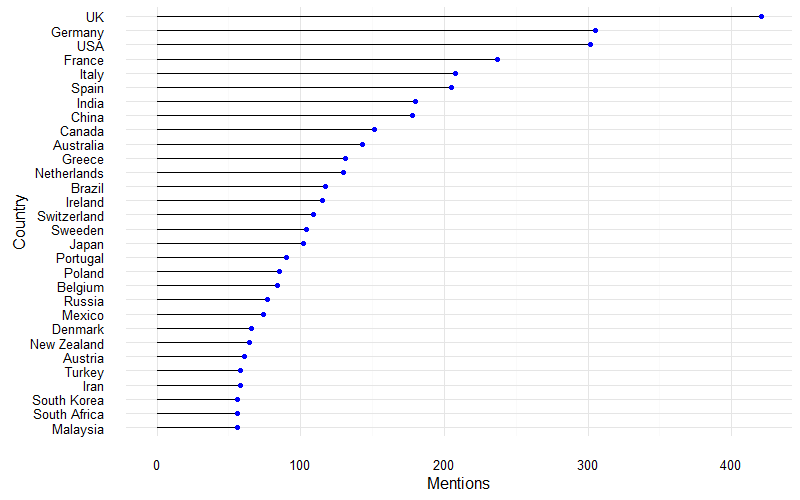
Finally, using code from a previous post I joined the country list to a worldmap to visualize the countries being mentioned.
#join mentions data with a world map
library(rworldmap)
tweetsGeo <- joinCountryData2Map(countryFreqsDF, joinCode="NAME", nameJoinColumn="country")

#create a map-shaped window
mapDevice('x11')

#plot
par(bg="grey15")
mapParameters <- mapCountryData(tweetsGeo, nameColumnToPlot="n", catMethod="fixedWidth",
                                borderCol="grey11", oceanCol="grey15",missingCountryCol = "yellow",addLegend = F,
                                mapTitle = "Science is Global",
                                colourPalette = c("#3182BD", "#00004d"))
do.call(addMapLegend,c(mapParameters,legendWidth = 0.5))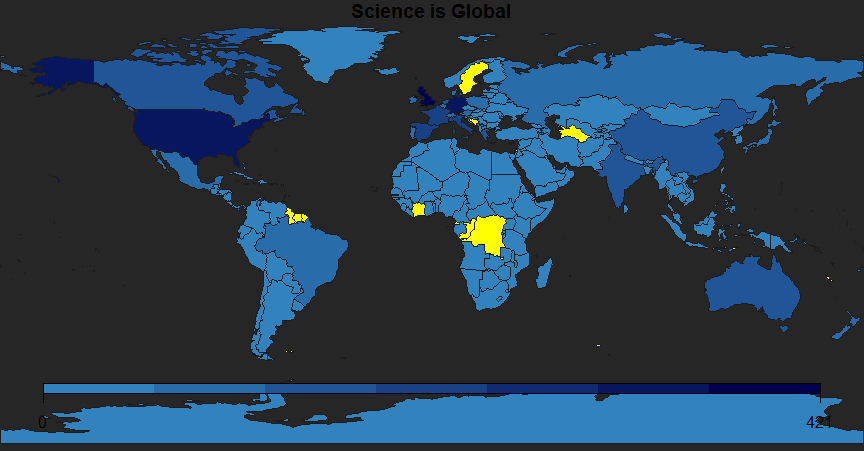
I put the countries with no matches in yellow to see the gaps, which in this case may not be true gaps because I made no steps to match the country names from my emoji flag table with the built in country names from the world map.
This is not a comprehensive analysis of the countries mentioned by people using the #ScienceisGlobal, since there are other ways to trigger emoji flags such as three-character “hashflags” (read about them here). I did not collect or count these, but the regex for catching these flags is not a problem: /\B#\w[a-zA-Z]+\w/ . Still, this code shoud work for anyone trying to parse emojis and especially national flags from Twitter data.
Contact me if the code isn’t working or if you have better alternatives for my hacky approach.