

More on extracting data from PDFs
Storing information in PDFs often adds lots of steps (and tears) before we can finally extract and reshape the data into a usable format and structure. Tables in PDFs are just strategically-positioned line borders and text, so we cannot just copy and paste the values into new aggregate datasets, or import them directly into our preferred statistical software. Tables in PDFs do not retain a sense of the rows and columns that hold the values, and that is a problem.
Some of you may have seen me rant about this last month…
Open Data Encryption: ensuring your data is both open and inaccessible (inspired by @LuisDVerde) #BESMacro2018 pic.twitter.com/V8WKQeTilU
— Tom August (@TomAugust85) July 11, 2018
This tweet also sums it up quite well…
PDFS ARE SO FUN. pic.twitter.com/HqHxwoGrAI
— Andrew Ba Tran (@abtran) August 17, 2018
I was watching a recording of this live data challenge featuring Hadley Wickham and Andrew Ba Tran, and I saw how quickly PDF tables with annoying features such as broken or wrapped values become problematic, even if you’re Hadley Wickham.
The table in question was small, with just five rows and six columns (see below). However, it had values broken up across lines so that they could fit in a single page. This leads to lots of awkward blank space.
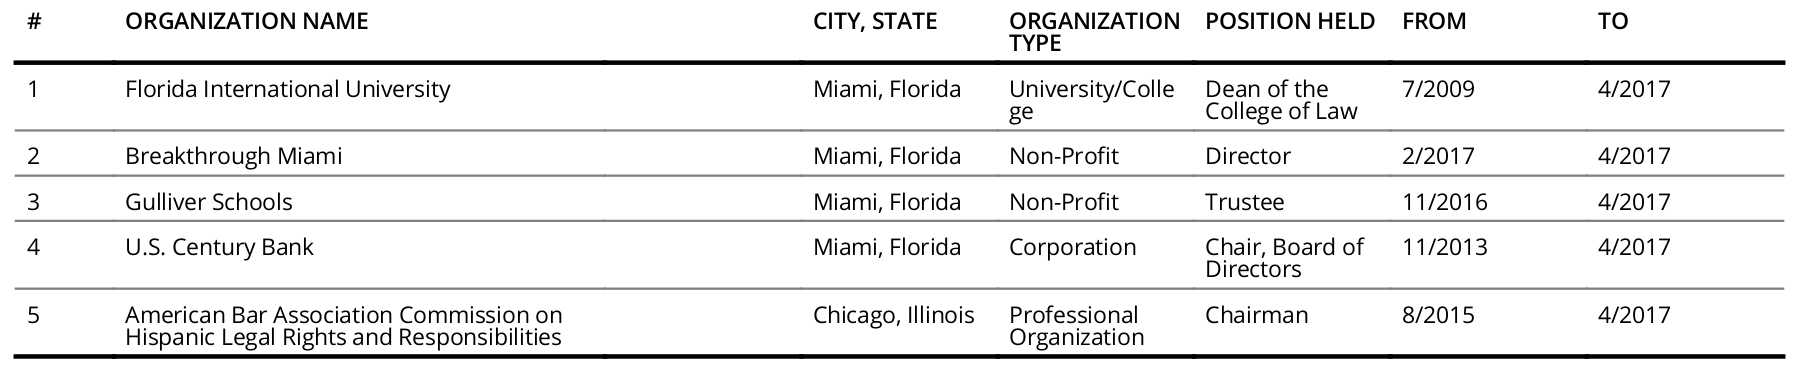
In the live codethrough, Hadley was time-limited and he probably didn’t want to to do something too complicated for all the students watching the live feed. Even so, he managed to come up with a solution that could eventually be rolled into a function and applied iteratively.
I’ve been working with PDF tables for months now, so I recognized the problems straight away and I knew how to address them. After much trial and error, I’ve written some functions to tackle these exact same issues. See this post for more details and check out the ‘unheadr’ package here.
Here’s my (armchair) take on the same table from the demo.
To get to the same starting table as Hadley, I used tabulizer to automatically extract and parse it. The first few columns got merged into one, but we’ll let that slide. The code is at the end of this post. The trick is to find a regular expression that will help us find and fix the broken values that define the observational units, and then use these as groups to unwrap the rest of the variables.
I’ve pasted the tabulizer output as a tribble and you can follow along if you install the relevant tidyverse packages, naniar, and ‘unheadr’ (install from GitHub).
# load libraries
library(dplyr)
library(unheadr)
library(stringr)
library(naniar)

# set up the data
acosta <-
    tibble::tribble(
  ~org,              ~type,         ~position,     ~from,      ~to,
  "1 Florida International University Miami, Florida", "University/Colle",     "Dean of the",  "7/2009", "4/2017",
  "",               "ge",  "College of Law",        "",       "",
  "2 Breakthrough Miami Miami, Florida",       "Non-Profit",        "Director",  "2/2017", "4/2017",
  "3 Gulliver Schools Miami, Florida",       "Non-Profit",         "Trustee", "11/2016", "4/2017",
  "4 U.S. Century Bank Miami, Florida",      "Corporation", "Chair, Board of", "11/2013", "4/2017",
  "",                 "",       "Directors",        "",       "",
  "5 American Bar Association Commission on Chicago, Illinois",     "Professional",        "Chairman",  "8/2015", "4/2017",
  "Hispanic Legal Rights and Responsibilities",     "Organization",                "",        "",       ""
)
This is the same output Hadley was working with, notice all the empty values.
> acosta
# A tibble: 8 x 5
  org                       type       position   from  to
  <chr>                     <chr>      <chr>      <chr> <chr>
1 1 Florida International … Universit… Dean of t… 7/20… 4/20…
2 ""                        ge         College o… ""    ""
3 2 Breakthrough Miami Mia… Non-Profit Director   2/20… 4/20…
4 3 Gulliver Schools Miami… Non-Profit Trustee    11/2… 4/20…
5 4 U.S. Century Bank Miam… Corporati… Chair, Bo… 11/2… 4/20…
6 ""                        ""         Directors  ""    ""
7 5 American Bar Associati… Professio… Chairman   8/20… 4/20…
8 Hispanic Legal Rights an… Organizat… ""         ""    ""
With various naniar + dplyr + tidyr + unheadr functions and some sneaky regex, we can tidy up the table quite easily.
acosta %>%
  replace_with_na_all(~.x == "") %>%
  unbreak_vals("^[A-Z]", org, org_ub) %>%
  unwrap_cols(org_ub, " ") %>%
  filter(str_detect(org, "^[^A-Z]")) %>%
  select(-org)
The extraneous rows are gone and the data is now usable.
# A tibble: 5 x 5
  org_ub                                type           position           from   to
  <chr>                                 <chr>          <chr>              <chr>  <chr>
1 1 Florida International University M… University/Co… Dean of the Colle… 7/2009 4/20…
2 2 Breakthrough Miami Miami, Florida   Non-Profit     Director           2/2017 4/20…
3 3 Gulliver Schools Miami, Florida     Non-Profit     Trustee            11/20… 4/20…
4 4 U.S. Century Bank Miami, Florida    Corporation    Chair, Board of D… 11/20… 4/20…
5 5 American Bar Association Commissio… Professional   Chairman           8/2015 4/20…
That’s it! Thanks for reading:)