

From photo to tibble
When I first wrote about tidy evaluation and the untangle2 function, I used restaurant menus as an example of how embedded subheaders are used to create small multiples of data (by type of menu item).
After a recent update to the tesseract optical character recognition (ocr) engine, I decided to try and digitize and parse a restaruant menu from a photo. I wanted to try with a real photo from a real menu, and I found this photo in my camera roll.
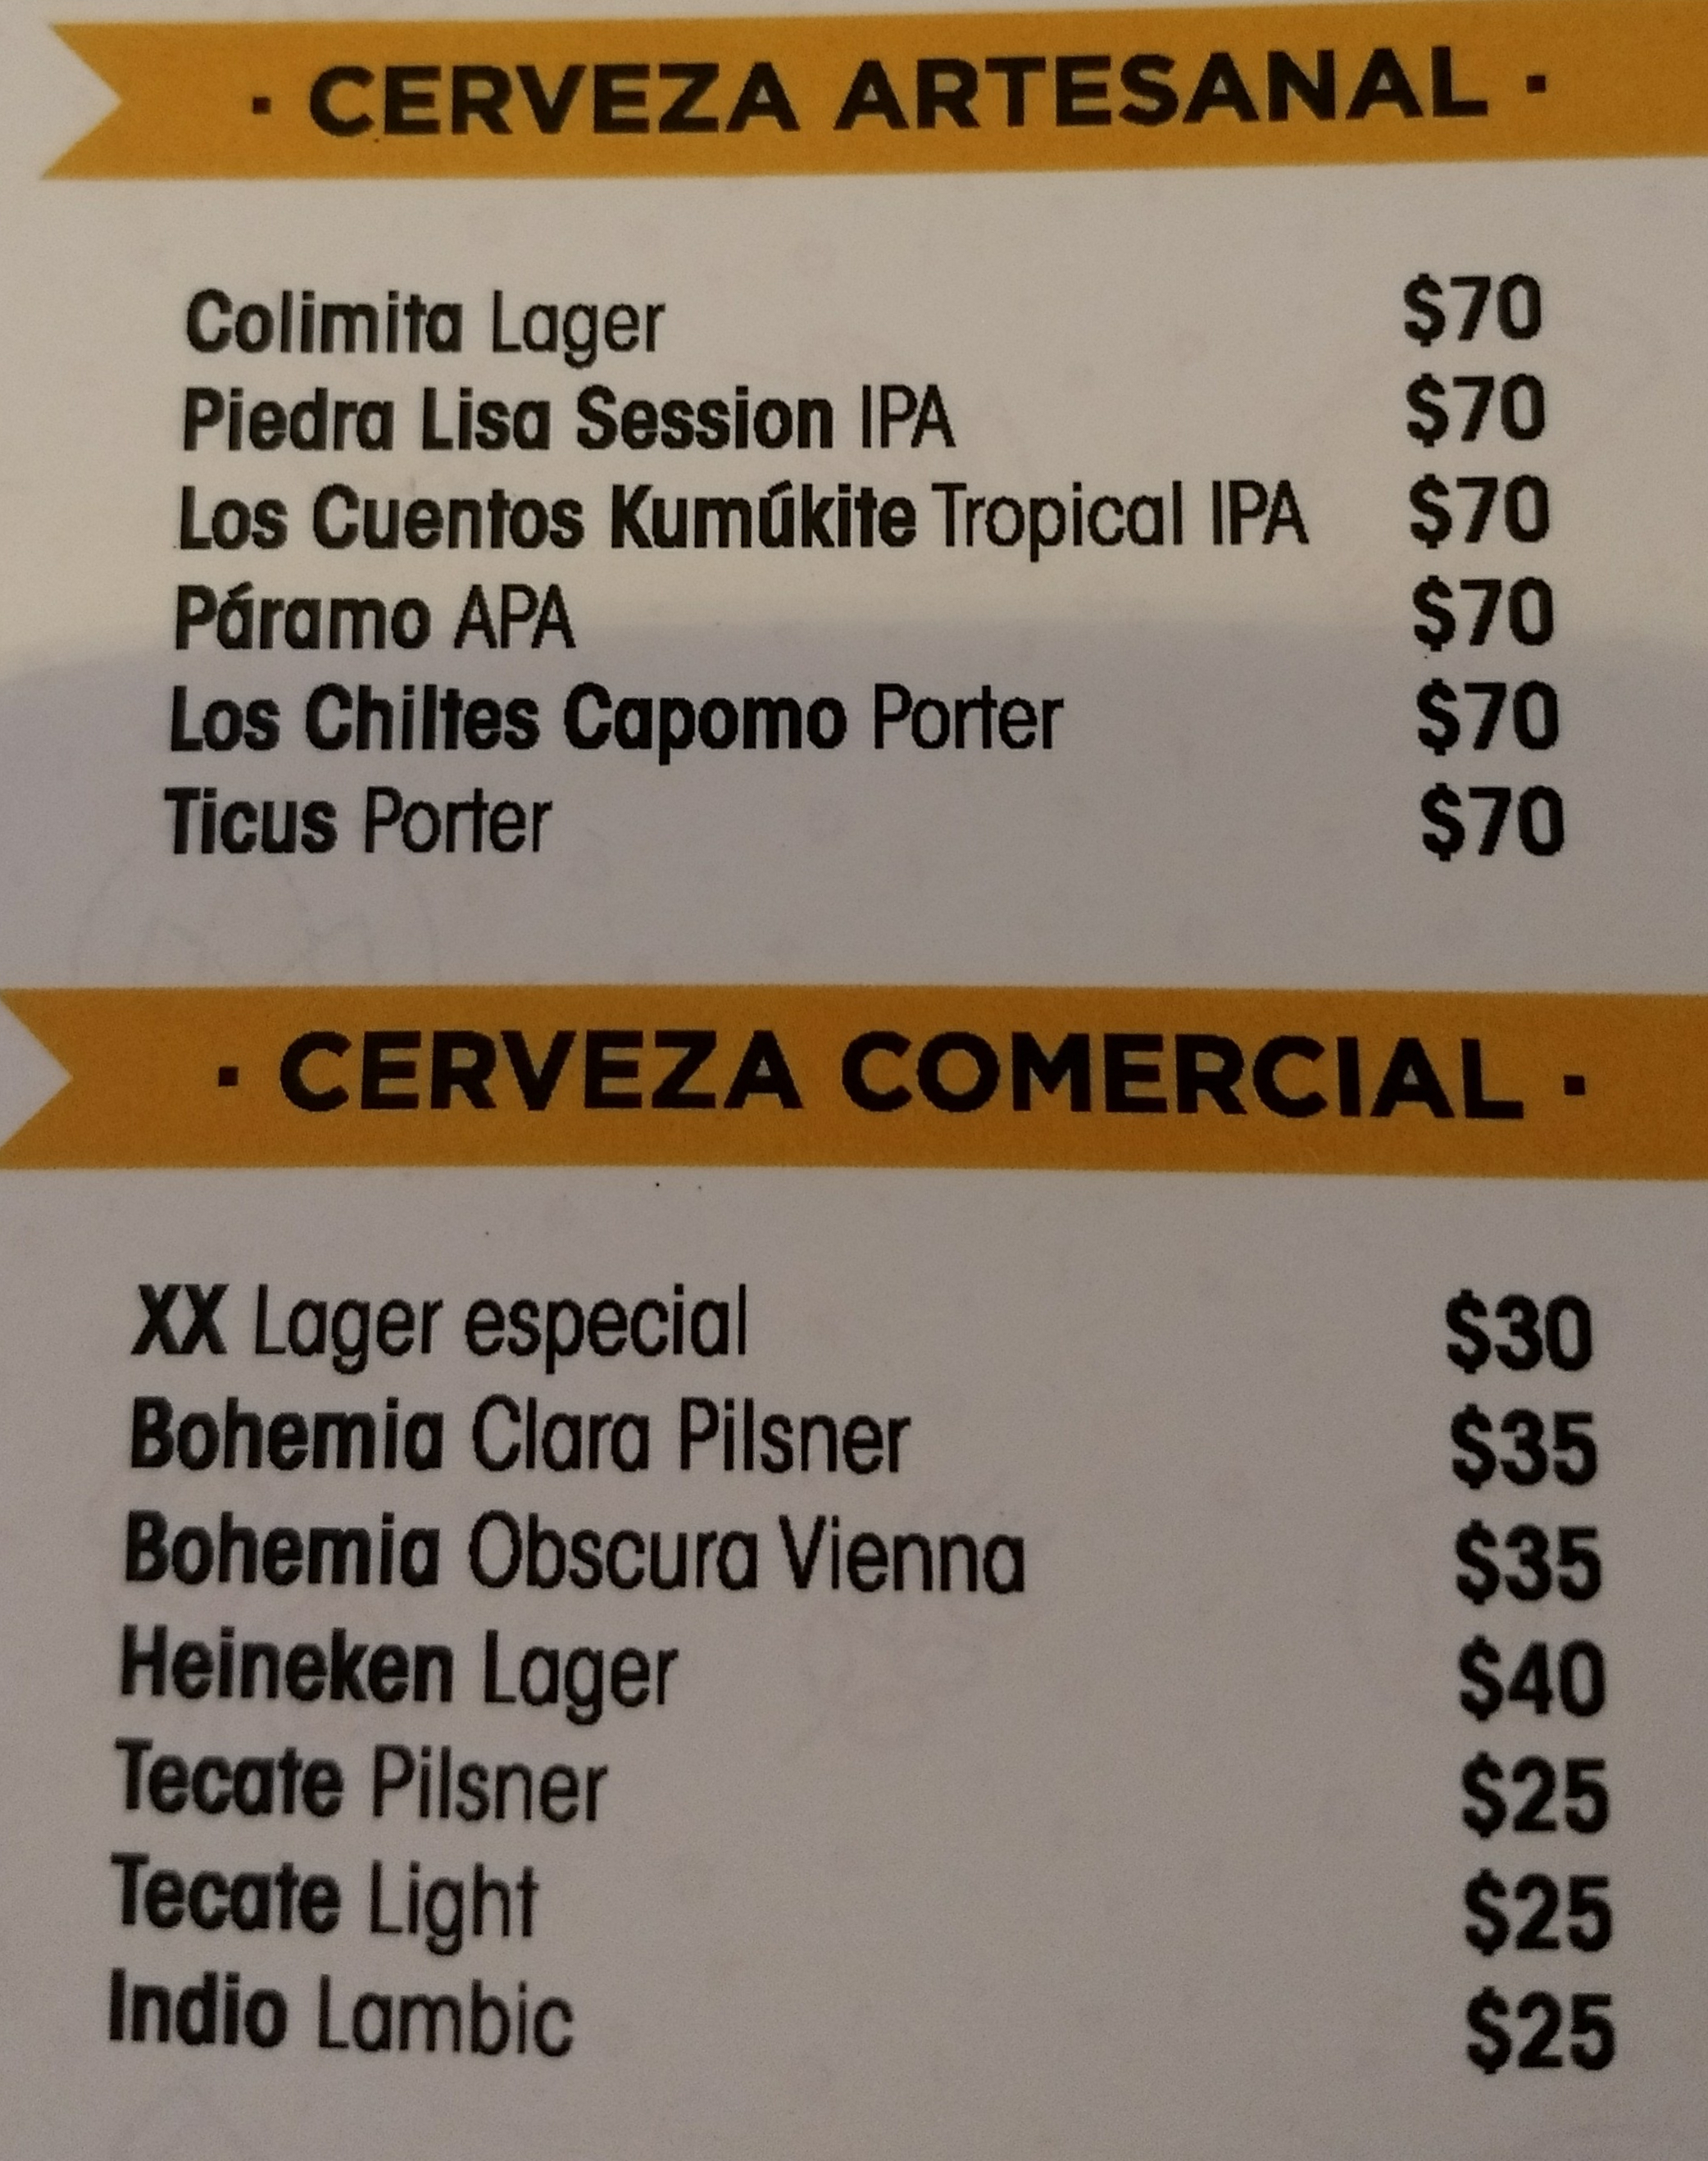
The menu is from a nice taco place in Puerto Vallarta. I cropped the photo to the beer selection. There are craft beers and commercial beers as little subsets of the menu, each with their own heading.
Code-through
Let’s ocr the text and then restructure the data.
To prepare the image for ocr, I followed some existing imagemagick tutorials, and the implementation in magick lets us chain the different operations together, making for very readable code. The code below will read the photo striaght from the web, so anyone can follow along after installing all the required packages.
# load packages
library(magick)
library(dplyr)
library(tesseract)
library(stringr)
library(unheadr)
library(tidyr)

beerpath <- ("https://github.com/luisDVA/luisdva.github.io/raw/master/assets/images/beer.jpg")
# read and process
beer <- magick::image_read(beerpath) %>%
        image_resize("25%") %>%
        image_convolve("DoG:15,100,0") %>%
        image_negate() %>%
        image_normalize() %>%
        image_blur(0,1) %>%
        image_convert(type="grayscale") %>%
        image_contrast() %>%
        image_enhance()
The resulting image looks like this (even though we don’t need to write it to disk for the ocr process).

The image_ocr function runs the optical character recognition on the image and returns a character vector, which we can structure into a tibble.
# ocr
beer_prices <- image_ocr(beer,language = c("spa","eng"))
beer_prices <- beer_prices %>% strsplit("\n") %>% unlist() %>% data_frame(prices=.)
In tibble form:
# A tibble: 15 x 1
   prices
   <chr>
 1 - CERVEZA ARTESANAL -
 2 Colimita Loger $70
 3 Piedra Lisa Session IPA $70
 4 Los Cuentos Kumúkite Tropical IPA $70
 5 Páramo APA $70
 6 Los Chiltes Capomo Porter $70
 7 Ticus Porter $70
 8 * CERVEZA COMERCIAL -+
 9 XX Loger especial $30
10 Bohemia Clara Pilsner $35
11 Bohemia Obscura Vienna $35
12 Heineken Lager $40
13 Tecate Pilsner $25
14 Tecate Light $25
15 Indio Lombic $25
There is some minor cleanup to be done. I like this real-world example because the original photo is not the best to begin, and the text itself is a mix of English, Spanish, and made up brand names. Even so, the ocr performed really well. Once the text is clean, we can put the prices into their own variable, and then use unheadr to turn the subheaders into a tidy grouping variable
# cleanup
beer_prices <-
beer_prices %>% mutate(prices=str_remove_all(prices,"[\\+\\-\\*]")) %>%
    mutate_all(str_squish) %>% mutate(prices=str_replace(prices,"Loger","Lager")) %>%
    mutate(prices=str_replace(prices,"Lombic","Lambic"))

# rectangling
beer_prices <-
beer_prices %>% separate(prices,into = c("beer","price"),sep = " \\$") %>%
        mutate(price=readr::parse_number(price)) %>%
        untangle2("CERVE",beer,type)
End result:
# A tibble: 13 x 3
   beer                              price type
   <chr>                             <dbl> <chr>
 1 Colimita Lager                       70 CERVEZA ARTESANAL
 2 Piedra Lisa Session IPA              70 CERVEZA ARTESANAL
 3 Los Cuentos Kumúkite Tropical IPA    70 CERVEZA ARTESANAL
 4 Páramo APA                           70 CERVEZA ARTESANAL
 5 Los Chiltes Capomo Porter            70 CERVEZA ARTESANAL
 6 Ticus Porter                         70 CERVEZA ARTESANAL
 7 XX Lager especial                    30 CERVEZA COMERCIAL
 8 Bohemia Clara Pilsner                35 CERVEZA COMERCIAL
 9 Bohemia Obscura Vienna               35 CERVEZA COMERCIAL
10 Heineken Lager                       40 CERVEZA COMERCIAL
11 Tecate Pilsner                       25 CERVEZA COMERCIAL
12 Tecate Light                         25 CERVEZA COMERCIAL
13 Indio Lambic                         25 CERVEZA COMERCIAL
With the menu items in a tidy structure, we can now group by beer type and get summary data or find the most or least expensive options.
# average price by type
beer_prices %>% group_by(type) %>% summarise(avg_price=mean(price))
# most expensive commercial brew
beer_prices %>% filter(type=="CERVEZA COMERCIAL") %>% top_n(1,price)
# least expensive
beer_prices %>% filter(type=="CERVEZA COMERCIAL") %>% top_n(-1,price)
# prices in US Dollars
beer_prices %>% mutate(prices_usd = price*0.05)
Let’s have a look at the results:
Average prices
# A tibble: 2 x 2
  type              avg_price
  <chr>                 <dbl>
1 CERVEZA ARTESANAL      70
2 CERVEZA COMERCIAL      30.7
Most expensive commercial beer
# A tibble: 1 x 3
  beer           price type
  <chr>          <dbl> <chr>
1 Heineken Lager    40 CERVEZA COMERCIAL
Least expensive (three-way tie)
# A tibble: 3 x 3
  beer           price type
  <chr>          <dbl> <chr>
1 Tecate Pilsner    25 CERVEZA COMERCIAL
2 Tecate Light      25 CERVEZA COMERCIAL
3 Indio Lambic      25 CERVEZA COMERCIAL
Convert prices to USD
# A tibble: 13 x 4
   beer                       price type          prices_usd
   <chr>                      <dbl> <chr>              <dbl>
 1 Colimita Lager                70 CERVEZA ARTE…       3.5
 2 Piedra Lisa Session IPA       70 CERVEZA ARTE…       3.5
 3 Los Cuentos Kumúkite Trop…    70 CERVEZA ARTE…       3.5
 4 Páramo APA                    70 CERVEZA ARTE…       3.5
 5 Los Chiltes Capomo Porter     70 CERVEZA ARTE…       3.5
 6 Ticus Porter                  70 CERVEZA ARTE…       3.5
 7 XX Lager especial             30 CERVEZA COME…       1.5
 8 Bohemia Clara Pilsner         35 CERVEZA COME…       1.75
 9 Bohemia Obscura Vienna        35 CERVEZA COME…       1.75
10 Heineken Lager                40 CERVEZA COME…       2
11 Tecate Pilsner                25 CERVEZA COME…       1.25
12 Tecate Light                  25 CERVEZA COME…       1.25
13 Indio Lambic                  25 CERVEZA COME…       1.25
The example is a little silly because all the craft beers have the same price, but I always wanted to apply the untangle2 function to a real restaurant menu, especially a non-digitized one from an actual photo.
Cheers!