
ggpup: place two random dog images next to any ggplot object
Note: I do not own the dog photos used below and I’ve been unable to find their licensing and reproduction policies. This code is merely for educational purposes and because I like dogs.
Update: Although I claim to minimize the chartjunk factor by putting the images outside the actual plots, images that are not used to depict data are a distraction and they can hurt the effectiveness of the data visualization. Thanks to Steve Haroz for pointing me to this summary on isotype visualization.
Earlier this month I shared a custom function (ggpup) to place two random dog images next to any ggplot object. I wrote the code partly in response to all the fuzz around the CatterPlot package, but also for fun and as a way to put together some cool things that can be done with R such as: web scraping, working with images from the web, and arranging them alongside plots.
My tweet was poorly-received, and I attribute it to me not breaking down the code in the Gist (and to cat bias in the rstats community), so here is a detailed rundown of the ggpup function. I like dogs and I don’t like chartjunk, so why not leave plots alone and instead use gridExtra’s flexibility to add cute dogs outside the plot margins.
These are the steps that the function goes through:
Web scraping
First we use the rvest package to scrape the page source behind this directory of dog breed profiles from dogtime.com, a comprehensive site about dogs, featuring advice on dog health, breeds, product reviews, etc. The site has a breed profiles page, with images for close to 200 different breeds. The breed photos in this index are hosted elsewhere on the site, but if we pull the page source as html it will contain the URLs for each one of the images displayed.
# load required packages
  require(dplyr)
  require(jpeg)
  require(grid)
  require(gridExtra)
  require(RCurl)
  require(rvest)
  require(stringi)
  require(extrafont)

# scrape a list of image URLS from the dogtime breed profiles homepage

# read page source
 dogIndex <- read_html("http://dogtime.com/dog-breeds/profiles")
# keep node of interest (identified using Selectorgadget)
 scrapedHtml <- dogIndex %>% html_nodes(".horizontal-group-listing") %>% toString()
Once we saved the html as a massive character string, we can use the stringi package and some nifty regex to keep only the image URLs. Because the stri_match_all functions return a list of character matrices, I used some awkward indexing to get a character vector of the image URLS. Let me know if you know of prettier ways to subset character matrices.
# match image urls
## Find everything that starts with "http"
### No white spaces allowed
### Ends with jpg
#### Note: this regex is for PC
 imgurlslist <- stri_match_all_regex(scrapedHtml,"(http[^\\s]+(jpg)\\b)")
# subset into character vector
 imgurls <- imgurlslist[[1]][,1]
Web images
To read images directly from the URLs, we use readJPEG from the JPEG package to read bitmap images and feed it to rasterGrob from the grid package, which saves them as raster objects for later use.
I should point out that I learned about this particular approach to working with web images while reading this post by The Data Game about creating basketball shot charts in R.
## scrape two dog breed photos (randomized)
### the photos are saved in their original size and aspect
# two random numbers
urlInd <- sample(length(imgurls),2,rep=F)
# for upper right corner
dogImg.URLU <- imgurls[urlInd[1]]
# save as a raster object
dogImgU <- rasterGrob(readJPEG(getURLContent(dogImg.URLU)))
# for lower right corner
dogImg.URLL <- imgurls[urlInd[2]]
# save as a raster object
dogImgL <- rasterGrob(readJPEG(getURLContent(dogImg.URLL)))
Prepare plotting parameters
Once we have our raster objects, we can already decide how to arrange them next to our plot. Because most of the dogs in the photos are facing left, I went with placing two of them in a single column to the right of the plot. The vignette for the gridExtra package shows us how to use a simple matrix to define a layout. For ggpup, this would be the corresponding matrix and its graphical representation.

# graphical parameters
# define plot layout
  lay <- rbind(c(1,1,2),
               c(1,1,3))
As another element that will go into the grid.arrange() function, we can set up some attribution text for the plot. I couldn’t find any licensing or photographer information for the photos so the text is pretty simple. The fontfamily parameter is optional, you may erase it or change to something else to match the fonts available for your system
# set up some attribution text
rightText=textGrob("images from www.dogtime.com", rot=90, gp=gpar(fontfamily = "Roboto Condensed Light"))
Make a plot and add dogs :)
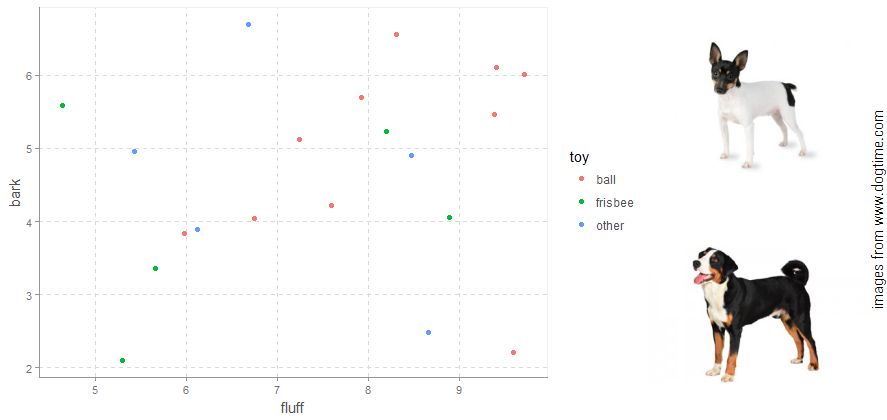
Once everything’s ready, we create a random ggplot object that goes into grid.arrange. The custom theme from the artyfarty package is optional, but I recommend it.
# create toy dataset
dat <- data.frame(fluff=runif(20,4,10),
                  bark =runif(20,1,7),
                  toy=sample(c("ball","frisbee","other"),20,replace = T))

library(ggplot2)
library(artyfarty)

# make a plot
plotobject <-
  ggplot(dat, aes(fluff, bark))+geom_point(aes(colour = toy))+
  theme_scientific()
# arrange the plot and the image side by side
grid.arrange(plotobject, dogImgU, dogImgL, layout_matrix=lay,widths=c(2,1,1),right=rightText)
This is the final product, and the ggpup function in the Gist below does the same thing in a more functional way, mainly as a way to redo the plot many times if you want different dog photos.
Let me know if anything isn’t working for you.
ggpup code