Cell and text formatting is everywhere
As part of my ongoing work1 with the joys of spreadsheets + formatting + R, this post explores the use of cell and text formatting in real-world spreadsheets at a large scale.
1 these [1,2,3,4] entries document my descent into insanity journey towards making R play nice with messy spreadsheets.
As a follow-up, this post summarizes patterns and prevalence of cell and text formatting in thousands of real-world spreadsheets from different fields. I did this out of curiosity, but also to help me improve the functionality of my unheadr and forgts packages, both of which are meant to help us work with formatted spreadsheets.
Before getting started, here is some recommended (mandatory) reading:
- Six Tips for Better Spreadsheets. Perkel (2022). Nature (PDF HERE) This brief writeup features insights from lots of experts in the data community
- Data Organization in Spreadsheets. Broman & Woo (2018). The American Statistician (full text here) THE definitive guide
The process
Broadly, this exploration has thee main steps: 1) obtain spreadsheets, 2) extract formatting data, and 3) summarize the patterns.
The code for each step available in this repo, which includes 25 random files for demonstration. The code runs fine but it can get sluggish, and includes some weird stylistic choices that come from trying out different LLM assistants for my ongoing LLMs + R roundup.
1. Get thousands of spreadsheets
Rather than scour the web myself, I downloaded the Fuse dataset. The Fuse corpus includes a collection of 249,376 unique spreadsheets from obtained by Barik et al. (2015) from the Common Crawl index.
This archive is several gigabytes in size. I worked locally using ugly absolute paths and only analyzed a random subset (~3000 of ~250,000) of the files.
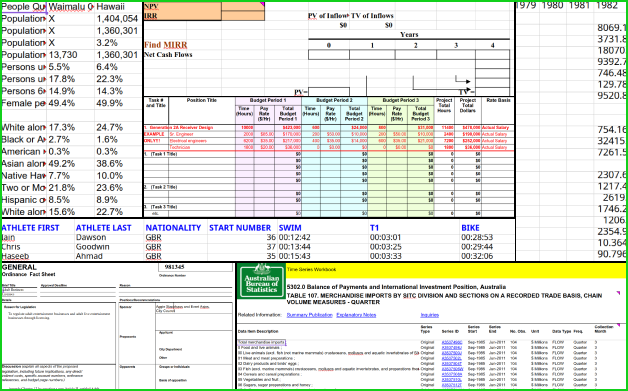
Some of the files look like this:

2. Batch process the formatting
The forgts pacakge already has functions (derived from code in unheadr) to extract formatting data from spreadsheets. With slight modifications, these functions can then be used iteratively to process files and ultimately summarize the formatting in each file.
The spreadsheets in Fuse are binary XLS files, so first we need to convert them to xlsx using libreoffice through the command line so that tidyxl can pull the formatting data stored in the underlying XML.
Internally, the functions call this system command whenever an input is not xlsx.
libreoffice --headless --convert-to xlsx myfile(another option could be to batch convert all binary files first)
I checked some of the conversions and didn’t notice any of the formatting breaking or being lost. I’m not sure but hopefully that’s the case for all the files. This implies having libreoffice installed and running the code with root privileges.
Several of the files were multisheet workbooks but the code only processes one sheet per file, sampled at random.
For a spreadsheet that looks like this:

The functions will output a list of two data frames that look like this:
$combined_format_summary
# A tibble: 3 × 8
  styling_arg cell_fill_count cell_text_count cell_fill_unique_values
  <chr>                 <int>           <int> <chr>
1 color                     7               1 #FF4000, #729FCF, #FFFF00
2 decorate                 NA               3 NA
3 weight                   NA               2 NA
# ℹ 4 more variables: cell_text_unique_values <chr>, fileid <chr>,
#   sheet <chr>, file_path <chr>

$combined_overall_stats
# A tibble: 6 × 7
  metric                 value color_code occurrences fileid sheet file_path
  <chr>                  <dbl> <chr>            <int> <chr>  <chr> <chr>
1 Percentage of Cells w…  68.8 NA                  NA binar… 1 of… binary/p…
2 Percentage of Variabl… 100   NA                  NA binar… 1 of… binary/p…
3 Most Common Color 1     NA   #FFFF00              4 binar… 1 of… binary/p…
4 Most Common Color 2     NA   #729FCF              2 binar… 1 of… binary/p…
5 Most Common Color 3     NA   #8D1D75              1 binar… 1 of… binary/p…
6 Most Common Color 4     NA   #FF4000              1 binar… 1 of… binary/p…
3. Overall summary
With two very long data frames that hold overall summaries and more detailed formatting information, some simple data operations can tell us that:
Total files: 3015
Files with formatting: 1877
Percentage of files with formatting: 62%
Mean percentage of cells formatted per sheet: 49%
The most commonly used color (for text, borders, or cell fills) was blue (hex code #0000FF), used in 228 files
In terms of text formatting (italic and bold text) that may or may not be used to encode data (e.g., bold text not just for emphasis but to indicate negative values), we get:
Proportion of files using:
Bold only: 47%;
Italic only: 2%;
Both bold and italic: %12;
Any (bold, italic, or both): 62%
This subset of ~3000 files is small compared with the entire corpus and the result of 62% of files using cell and text formatting is much higher than the 25% reported by Sing et al. (2022) for a massive corpus of 1.8 million files examined.
Even if the real proportion of spreadsheets with formatting is low, and especially formatting used to encode data, I still think it is worth finding ways to deal with it in R.
This is particulary relevent nowadays, as there is a growing need to transform complex documents into simpler representations that can be fed into large language models. We just need to look at how Microsoft recently released markitdown, a powerful python tool for converting various files to Markdown for indexing, text analysis, and other AI-related purposes.
I’ll continue working on forgts to convert formatted spreadhsheets to gts, and hopefully also rewrite some of the functions in unheadr that paste the formatting information as strings when importing these kinds of files.
All feedback welcome

