Esta publicación está disponible en español aqui
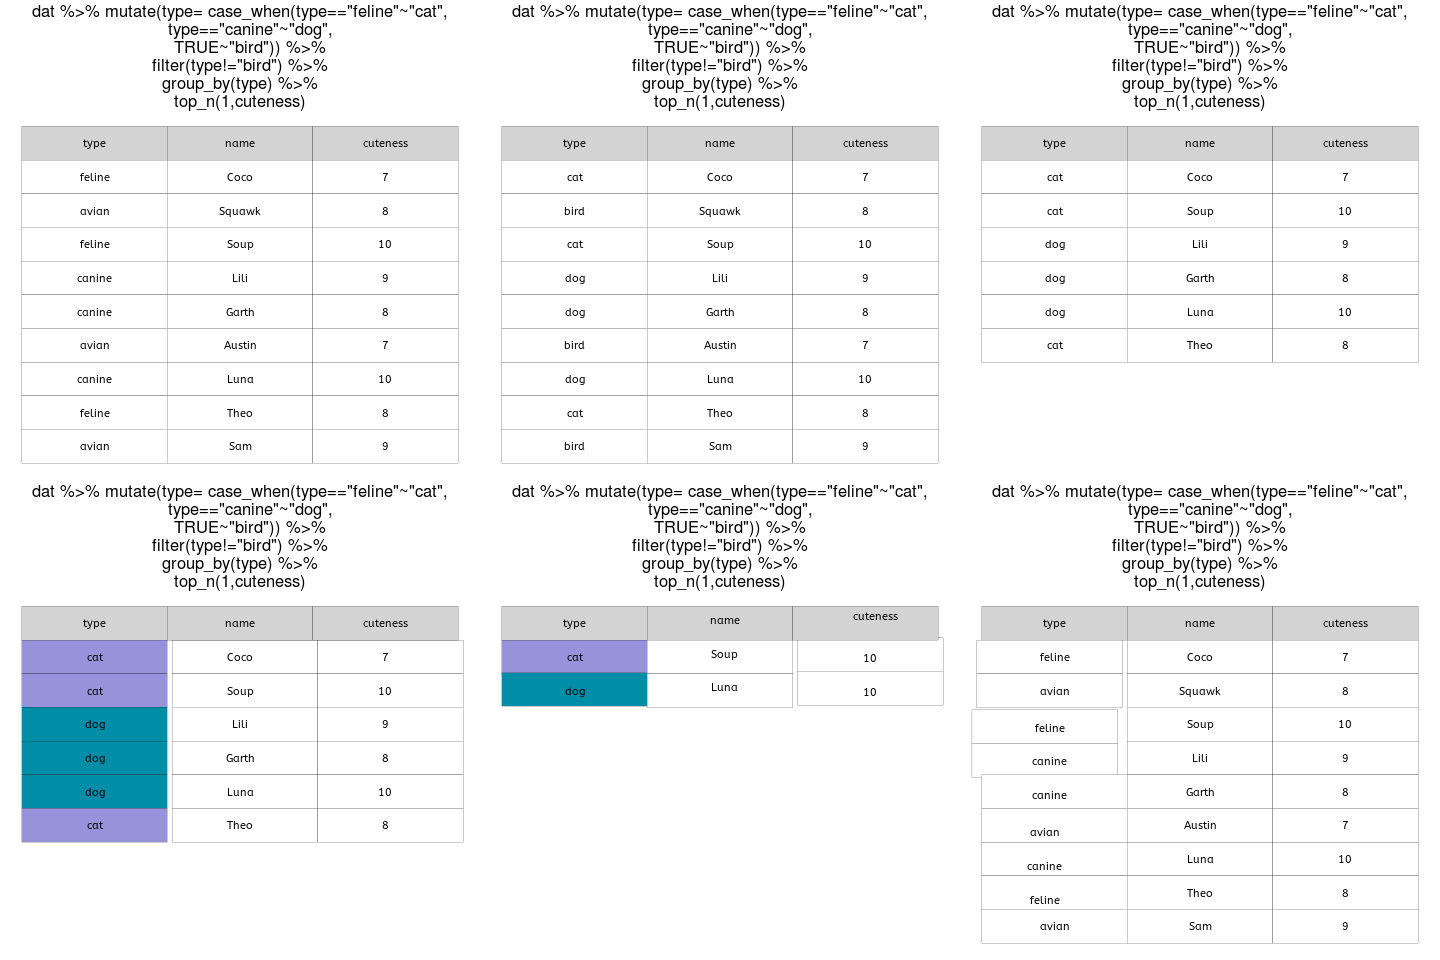
Update - August 2018: Click here for an animated demo of the top_n function.

When tables contain data for many different groups, getting the maximum and minimum values (or the top n or bottom n values) of a continuous variable within each group is a common task.
These are some simple examples from my work in biology:
- largest and smallest species in a taxonomic group (e.g. birds, mammals, reptiles)
- best represented taxonomic groups in a collection, grouped by country
Despite the prevalence of this task in data wrangling for biodiversity research, I couldn’t find any documentation online so I thought I should contribute.
The following is an approach that I saw someone else do using a spreadsheet program, and it inspired this post. There’s nothing particularly wrong with doing it this way, it just takes more time, is harder to document, and has to be repeated manually in case the original table is modified.
- Make a new copy of the original spreadsheet.
- Separate each group into a new sheet within the workbook (copying and pasting after arranging the rows so the groups appear together).
- Use conditional formatting to highlight the top and bottom values in a column.
- Delete the rows that aren’t highlighted.
- Copy and paste everything into a single table.
An alternative is to use R and the capability of the dplyr package to work on groups, as well as the top_n function (a convenient wrapper that uses filter and min_rank to select the top or bottom entries in each group).
In this example, we can use brain mass data for hundreds of mammals from this paper by Gonzalez Voyer et al. and extract the maximum and minimum values for brain mass within each taxonomic group (orders in this case).
First, we download the data directly from Dryad and have a look at its structure and properties. Because we want maximum and minimum values, we can filter out orders that are either monotypic or have only one entry in this database.
# load the required packages (install first if needed)
library(dplyr)
library(ggplot2)

# download the table directly from Dryad
brains <- read.csv("http://datadryad.org/bitstream/handle/10255/dryad.114692/Gonzalez-Voyer_et_al_Evolution_Brain_Data.csv?sequence=1")

# check it out
glimpse(brains)

# count how many entries per order
brains %>% count(Taxonomic_order)
# new DF with only orders that have 2 or more species
brains2 <- brains %>% group_by(Taxonomic_order) %>% filter(n()>1)
Now we can use pipes, the group_by function and top_n to get the top and bottom values within each group. In this case, I get the top and bottom values separately and then bind the rows using bind_rows.
# create data frame with top values of each group
brtop <-   brains2 %>% group_by(Taxonomic_order) %>% top_n(1,Brain_mass_g)
# create data frame with bottom values of each group
## note that we use a minus sign rather than a different function
brbottom <-   brains2 %>% group_by(Taxonomic_order) %>% top_n(-1,Brain_mass_g)
# bind and arrange
minmaxBr <- bind_rows(brtop,brbottom)
minmaxBr <- arrange(minmaxBr,Taxonomic_Order)
# look at the result for bats
minmaxBr %>% filter(Taxonomic_order=="Chiroptera")| Taxonomic_order | Species_name | Brain_mass_g |
|---|---|---|
| Chiroptera | Pteropus_giganteus | 7.605096 |
| Chiroptera | Pipistrellus_subflavus | 0.125000 |
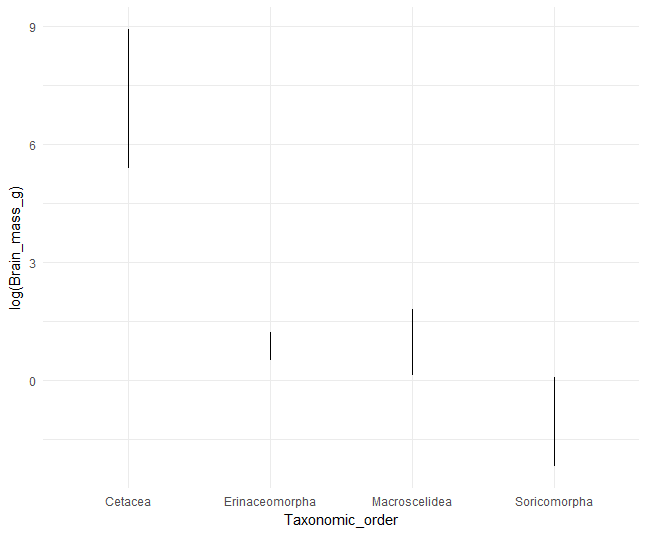
In this new data frame we see that the bat (Order Chiroptera) with the highest brain mass is Pteropus giganteus and the bat with the lowest brain mass is the tiny Pipistrellus subflavus. We can even plot the resulting maximum and minimum brain mass values for a few orders (on a log scale, using a hacky approach to geom_path) to see some of the variation.
# plot the min and max values for a few random orders
minmaxBr %>% filter(Taxonomic_order %in% sample(levels(minmaxBr$Taxonomic_order),5)) %>%
ggplot(aes(x=Taxonomic_order,y=log(Brain_mass_g)))+geom_path()+theme_minimal()
Note that in case of ties, the documentation states that top_n() either takes all rows with a value, or none.
If you found this helpful or if anything isn’t working properly, please get in touch. Happy 2017, LD.
