Data Rectangling Resource Roundup
Earlier this month, I spotted this definition in the tidyr package vignette:
Rectangling is the art and craft of taking a deeply nested list (often sourced from wild caught JSON or XML) and taming it into a tidy data set of rows and columns.
“Data rectangling” was coined by Jenny Bryan around 2016-2017 and has been making the rounds ever since.
Data rectangling originally meant taking nested data and lists of lists, and ultimately getting a nice rectangular data frame thanks to the flexibility of list-columns.
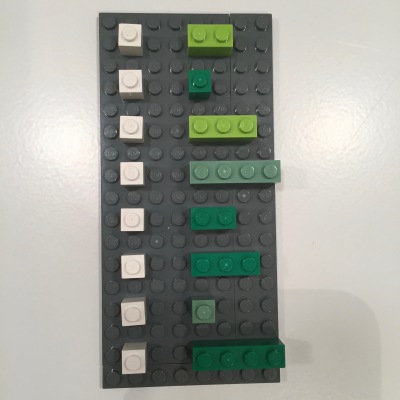
Here is a very suitable example (from Jenny’s Lego-Rstats gallery) of how data can be nested and/or rectangled:
Data frames are not limited to atomic vectors.

In parallel, this great guide on data organization in spreadsheets by Karl Broman and Kara Woo also suggests making data rectangular, with rows corresponding to subjects and columns corresponding to variables. This recommendation addresses flat tables and their layouts without necessarily mentioning nested arrays, lists or JSON/XML formats.
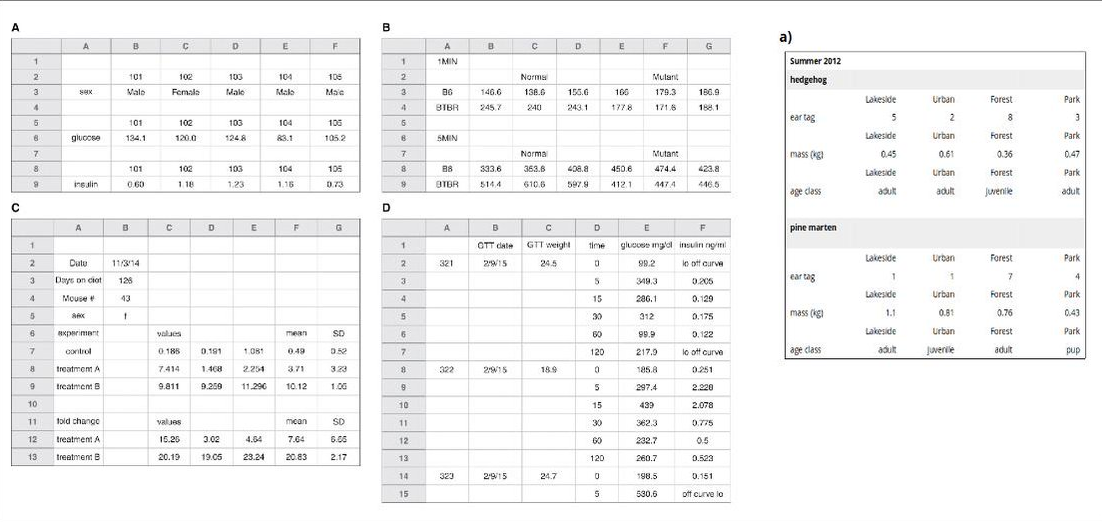
In a recent guide for sharing human and machine-readable biodiversity data, we (myself, Natalie Cooper and Guillermo D’Elía) kept the same focus on layouts when referring explicitly to data rectangling. As examples of of non-rectangular data, we mentioned unstructured text, spreadsheets holding multiple disparate tables, nested lists, or more complex data structures such as JavaScript Object Notation (JSON) files.
The focus on layouts in these two publications is somewhat in conflict with the original definition of data rectangling, which focuses on the nested data.
When I asked for clarification, Hadley Wickham rightfully noted that in the examples of ‘non-rectangular’ data from both of these publications, the data are already in a single rectangle with rows and columns and that ‘data tidying’ would be more suitable for the process of making such data usable.

However, Jenny said of the same examples that those data are ‘rectangular’ in the same way that this cat is bowl-shaped.
but sometimes such data is “rectangular” in the same sense that this cat is “bowl-shaped” 😂 pic.twitter.com/ZmxvgcV57d
— Jenny Bryan (@JennyBryan) May 9, 2019
Wherever we decide to place ‘data rectangling’ on the spectrum of untidy data to deeply nested lists and complex objects, here are some relevant resources:
Principles
Presentation by Jenny Bryan at RStudio::conf
-video
-slides
Rectangling (non-nested data)
Data organization in spreadsheets
Must-read guide for data entry and management.
Good practices for sharing biodiversity data
Tips for creating and sharing human and machine-readable data.
Get good data out of bad spreadsheets
Duncan Garmonsway beheads and unpivots messy and not very rectangular spreadsheet data in this recent talk.
Nested data
tidyr vignette
Three worked examples with geocoding data, Game of Thrones, and discographic material
Kung Fu films analysis
Exploring martial arts film trends from a JSON data source, by Jim Vallandingham.
list-column tutorial
Essential background reading, from a purrr tutorial by Jenny Bryan.
Relevant packages
R
tidyr - Reshaping and unnesting data, tidyverse style.
tidyxl - Rectangling spreadsheets and dealing with meaningful formatting.
tidyjson - A pipe and dplyr-friendy way to parse JSON files.
unpivotr - For complex and irregular data layouts. Especially useful for data with mutliple headers.
unheadr - For subheaders embedded in the data rectangle.
Python
Databaker - Jupyter notebook tool for working with spreadsheets.
If I’m missing anything let me know and I’ll add it.

