Using Tidy Evaluation to untangle header rows
An R function to put interspersed header rows into their own column.

Personal site with research updates, blog posts, and bio.
An R function to put interspersed header rows into their own column.
Wrangling commonly-used data formats. Part 2 - Compound values.
Wrangling commonly-used data formats. Part 1 - GenBank accession tables.
Recoding binary dummy variables into factors. Includes tidyverse and base R approaches.
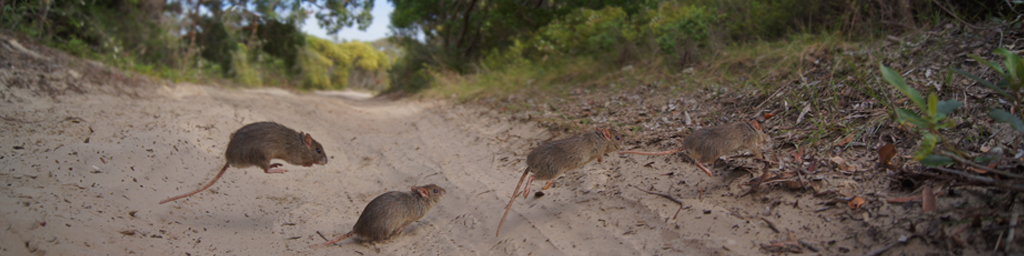
Resumen del seminario mensual de actualización en literatura científica del grupo de Mastozoología, MZFC-UNAM.
Working with data describing dog breeds and how they are related.
Extracting dog names from tweets by WeRateDogs.
Text analysis applied to mammalian common names.