
Tidying formatted spreadsheets with unheadr
unheadr
0.2.1 is now on CRAN, so here is an updated example for using the two main functions in the package.
The screenshot below comes from a spreadsheet with data from a regional event for the American Kennel Club’s Coursing Ability Test (CAT), which consists of timed 100-yard dashes for dogs. This is a subsample of an original xlsx file that I found online at some point and randomized.
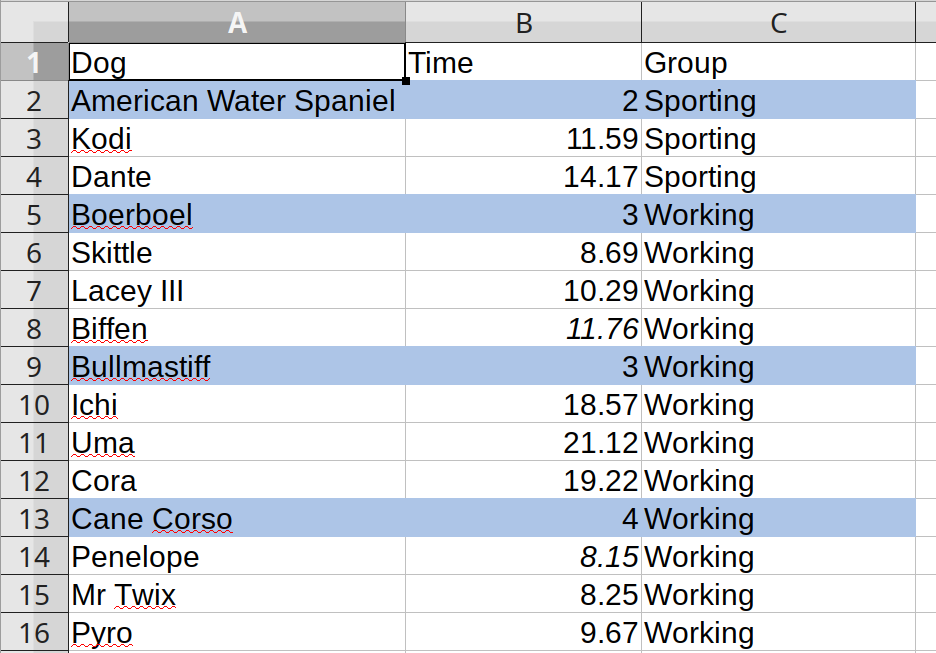
The breeds are embedded in the same column (variable) that holds the names of the individual dogs. Fortunately, the rows with the breeds have cell highlighting. Otherwise there would be no easy way to identify the breed names without prior knowledge (e.g. is Vizsla a name or a breed?). These ‘embedded subheaders’ approach is not quite tidy, and it would not be easy to, for example, calculate the average time by breed.
To work with these data in R, we can use the readxl package to import the xlsx file.
library(dplyr) # A Grammar of Data Manipulation
library(unheadr) # Handle Data with Messy Header Rows and Broken Values

# get the spreadsheet
CATspsheet <- tempfile(fileext = ".xlsx")
curl::curl_download("https://github.com/luisDVA/codeluis/blob/master/fastCAT2015.xlsx?raw=true", CATspsheet)
# import with readxl
readxl::read_excel(CATspsheet)
Let’s have a look at the ouput from readxl::read_excel().
# A tibble: 32 x 3
   Dog                     Time Group
   <chr>                  <dbl> <chr>
 1 American Water Spaniel  2    Sporting
 2 Kodi                   11.6  Sporting
 3 Dante                  14.2  Sporting
 4 Boerboel                3    Working
 5 Skittle                 8.69 Working
 6 Lacey III              10.3  Working
 7 Biffen                 11.8  Working
 8 Bullmastiff             3    Working
 9 Ichi                   18.6  Working
10 Uma                    21.1  Working
# … with 22 more rows
With unheadr, we can turn the spreadsheet formatting (meaningful formatting) into character strings and then work with that.
# import and annotate
breeds_dat <- annotate_mf(CATspsheet, orig = Dog, new = dog_annotated)
breeds_dat
Applying the annotate_mf() function to annotate the Dogs variable, which adds a new variable that tells us about the type of formatting in each cell. The cell highlighting and HTML color code are appended onto the variable of interest.
# A tibble: 32 x 4
   Dog                    dog_annotated                                  Time Group
   <chr>                  <chr>                                         <dbl> <chr>
 1 American Water Spaniel (highlighted-FFADC5E7) American Water Spaniel  2    Sporting
 2 Kodi                   Kodi                                          11.6  Sporting
 3 Dante                  Dante                                         14.2  Sporting
 4 Boerboel               (highlighted-FFADC5E7) Boerboel                3    Working
 5 Skittle                Skittle                                        8.69 Working
 6 Lacey III              Lacey III                                     10.3  Working
 7 Biffen                 Biffen                                        11.8  Working
 8 Bullmastiff            (highlighted-FFADC5E7) Bullmastiff             3    Working
 9 Ichi                   Ichi                                          18.6  Working
10 Uma                    Uma                                           21.1  Working
# … with 22 more rows
We can then match the annotation strings with regex, and put the breed names into their own variable, leading to a tidy rectangular table (after some minor cleanup).
# match the rows with breed names and clean up
breeds_dat <- breeds_dat %>%
  untangle2("^\\(", orig = dog_annotated, new = breed) %>%
  mutate(breed = stringr::str_remove(breed, "^\\(.+\\)\\s")) %>%
  select(-dog_annotated)
Tidiness
# A tibble: 24 x 4
   Dog        Time Group    breed
   <chr>     <dbl> <chr>    <chr>
 1 Kodi      11.6  Sporting American Water Spaniel
 2 Dante     14.2  Sporting American Water Spaniel
 3 Skittle    8.69 Working  Boerboel
 4 Lacey III 10.3  Working  Boerboel
 5 Biffen    11.8  Working  Boerboel
 6 Ichi      18.6  Working  Bullmastiff
 7 Uma       21.1  Working  Bullmastiff
 8 Cora      19.2  Working  Bullmastiff
 9 Penelope   8.15 Working  Cane Corso
10 Mr Twix    8.25 Working  Cane Corso
# … with 14 more rows
On the event website, I later learned that italic text in the Time variable indicates that a dog was disqualified (for whatever reason). We can repeat the previous steps with the times variable, and join the resulting tables.
# repeat with Time variable
times_dat <- annotate_mf("pup/fastCAT2015.xlsx", orig = Time, new = time_annotated)
times_annotated <- times_dat %>% mutate(disqualified = if_else(stringr::str_detect(time_annotated, "italic"), TRUE, FALSE))
left_join(breeds_dat, times_annotated) %>% select(-time_annotated)
# A tibble: 24 x 5
Dog Time Group breed disqualified
<chr> <dbl> <chr> <chr> <lgl>
1 Kodi 11.6 Sporting American Water Spaniel FALSE
2 Dante 14.2 Sporting American Water Spaniel FALSE
3 Skittle 8.69 Working Boerboel FALSE
4 Lacey III 10.3 Working Boerboel FALSE
5 Biffen 11.8 Working Boerboel TRUE
6 Ichi 18.6 Working Bullmastiff FALSE
7 Uma 21.1 Working Bullmastiff FALSE
8 Cora 19.2 Working Bullmastiff FALSE
9 Penelope 8.15 Working Cane Corso TRUE
10 Mr Twix 8.25 Working Cane Corso FALSE
# … with 14 more rowsPretty cool!
Writing this post made me realize that I should probably rewrite annotate_mf() so that we can specify if we need to skip rows when importing spreadsheets, and also think about a version of the function that can be applied across multiple variables simultaneously. If anyone wants to contribute please reach out.