

Merging rows in R
Recently, I was tagged in a tweet seeking advice for rectangling a particularly messy data structure.
depending on whether they need to procrastinate on something even more odious, I could imagine @nacnudus or @LuisDVerde getting sucked in by certain aspects of this 😉
— Jenny Bryan (@JennyBryan) December 10, 2019
The data in question, and a nice way to restructure them are found in this gist. I could not come up with a general approach, but there were several helpful solutions in the replies to the tweet. This data structure is now described as an issue in the unpivotr repository by Duncan Garmonsway.
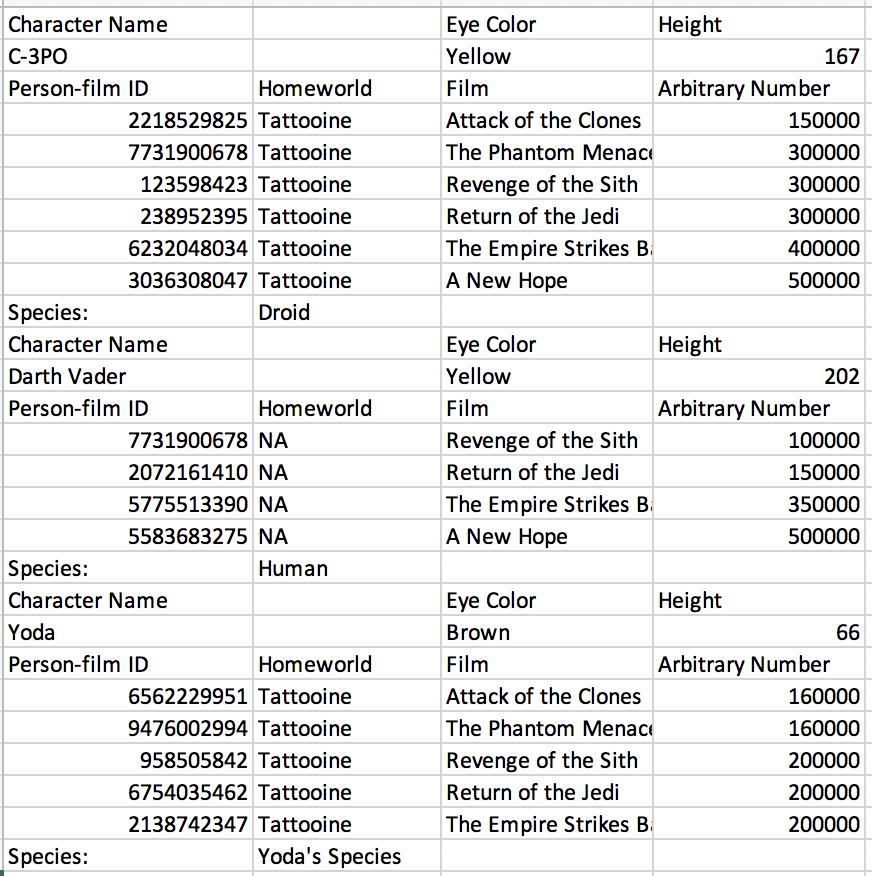
Although there wasn’t much I could do, I noted that the data had two issues relevant to my work with the unheadr package.
- Small multiples (subsets of the same data stacked on top of each other)
- Broken rows (values of two contiguous rows broken up and padded with empty or NA values)
These data helped me complete work on a function to merge rows in a data frame. The unbreak_rows() function is now part of unheadr. Essentially, rows (or sets of rows) that can be identified with a regular expression in any of the columns are merged into a single row. The values of the lagging rows are pasted onto the values in the leading row, whitespace is squished, and the lagging row is dropped.
Let’s try it out with an example using made up data about basketball records for different players and seasons.
| v1 | v2 | v3 |
|---|---|---|
| Player | Most points | Season |
| NA | in a game | (year ending) |
| Sleve McDichael | 55 | 2001 |
| Dean Wesrey | 43 | 2000 |
| Karl Dandleton | 41 | 2002 |
| NA | Most varsity | NA |
| NA | games played | NA |
| Mike Sernandez | 111 | 2000 |
| Glenallen Mixon | 109 | 2002 |
| Rey McSriff | 104 | 2001 |
| NA | Most rebounds | NA |
| NA | in a game | NA |
| Kevin Nogilny | 24 | 2002 |
| Karl Dandleton | 21 | 2000 |
| Todd Bonzalez | 21 | 2001 |
This table has header rows embedded in the data, and for whatever reason the values are broken into separate cells.
In this case, the variable v2 has a repeating pattern (“Most…”) that can be matched multiple times to identify the broken rows.
Let’s see:
# remotes::install_github("luisDVA/unheadr") # for the latest version
library(unheadr)
library(dplyr)
library(tidyr)
library(purrr)

# set up the data
bball2 <-
  data.frame(
    stringsAsFactors = FALSE,
    v1 = c(
      "Player", NA, "Sleve McDichael", "Dean Wesrey",
      "Karl Dandleton", NA, NA, "Mike Sernandez",
      "Glenallen Mixon", "Rey McSriff", NA, NA, "Kevin Nogilny",
      "Karl Dandleton", "Todd Bonzalez"
    ),
    v2 = c(
      "Most points", "in a game", "55", "43", "41", "Most varsity",
      "games played", "111", "109", "104",
      "Most rebounds", "in a game", "24", "21", "21"
    ),
    v3 = c(
      "Season", "(year ending)", "2001", "2000", "2002", NA, NA,
      "2000", "2002", "2001", NA, NA, "2002", "2000",
      "2001"
    )
  )
Unbreaking the rows
unbreak_rows(tibble::as_tibble(bball2), "^Most", v2)Gives us this:
| v1 | v2 | v3 |
|---|---|---|
| Player | Most points in a game | Season (year ending) |
| Sleve McDichael | 55 | 2001 |
| Dean Wesrey | 43 | 2000 |
| Karl Dandleton | 41 | 2002 |
| Most varsity games played | ||
| Mike Sernandez | 111 | 2000 |
| Glenallen Mixon | 109 | 2002 |
| Rey McSriff | 104 | 2001 |
| Most rebounds in a game | ||
| Kevin Nogilny | 24 | 2002 |
| Karl Dandleton | 21 | 2000 |
| Todd Bonzalez | 21 | 2001 |
It may be a good idea to fill in the empty subheaders. This approach uses mutate_all() to conditionally replace the empty values in each column with the value in the first row.
unbreak_rows(tibble::as_tibble(bball2), "^Most", v2) %>%
mutate_all(., ~ ifelse(. == "", .[1], .))| v1 | v2 | v3 |
|---|---|---|
| Player | Most points in a game | Season (year ending) |
| Sleve McDichael | 55 | 2001 |
| Dean Wesrey | 43 | 2000 |
| Karl Dandleton | 41 | 2002 |
| Player | Most varsity games played | Season (year ending) |
| Mike Sernandez | 111 | 2000 |
| Glenallen Mixon | 109 | 2002 |
| Rey McSriff | 104 | 2001 |
| Player | Most rebounds in a game | Season (year ending) |
| Kevin Nogilny | 24 | 2002 |
| Karl Dandleton | 21 | 2000 |
| Todd Bonzalez | 21 | 2001 |
To rectangle this set of small multiples, this next approach tags each one (type of sporting record) so they can be grouped and split for iterative cleaning of the variable names before a final join.
unbreak_rows(tibble::as_tibble(bball2), "Most", v2) %>%
  mutate_all(., ~ ifelse(. == "", .[1], .)) %>%
  mutate(award_label = ifelse(stringr::str_detect(v2, "^Most"), 1:1000, NA)) %>%
  fill(award_label) %>%
  group_split(award_label) %>%
  map(select, -award_label) %>%
  map(~ setNames(.x, .x[1, ])) %>%
  map(slice, -1) %>%
  reduce(full_join) %>%
  select(-`Season (year ending)`, everything())
A tidier version of the data:
| Player | Most points in a game | Most varsity games played | Most rebounds in a game | Season (year ending) |
|---|---|---|---|---|
| Sleve McDichael | 55 | NA | NA | 2001 |
| Dean Wesrey | 43 | NA | NA | 2000 |
| Karl Dandleton | 41 | NA | NA | 2002 |
| Mike Sernandez | NA | 111 | NA | 2000 |
| Glenallen Mixon | NA | 109 | NA | 2002 |
| Rey McSriff | NA | 104 | NA | 2001 |
| Kevin Nogilny | NA | NA | 24 | 2002 |
| Karl Dandleton | NA | NA | 21 | 2000 |
| Todd Bonzalez | NA | NA | 21 | 2001 |
Is this helpful? let me know 🧐