

Research patterns in new species of mammals
Most people assume that most, if not all, mammals are known to science. Although mammals are a charismatic and well-studied group, this assumption is mistaken. In this paper from 2009, Ceballos and Ehrlich found that 408 new species of terrestrial mammals have been described since 1993 - when the first comprehensive database of mammalian taxonomy (Mammal Species of the World; MSW) was published. Over half of these new mammals are cryptic species (not easily recognized by morphological features), but many others are large and distinctive. We are nowhere near a complete inventory of mammalian diversity. New species are formally described after painstaking efforts by taxonomy-oriented scientists at a surprisingly consistent pace.
Sometimes, mammal discoveries get a lot of media attention when the new species is very cute, very large, or very threatened (or any combination of these factors). In some cases, the circumstances surrounding the discovery of a new species make for an interesting and newsworthy media piece. The rest of the time, new species descriptions are published without much fanfare.
Then what?
I work with mammals, and try to keep up with new species and with changes in taxonomic opinion. Even with my level of familiarity, I’m barely aware of new species that don’t get widespread coverage or occur beyond my regions of expertise. People won’t research what they’re not aware of, and this got me thinking about patterns of research effort for new species. As a first approach and for this post, I quantified research effort (as the number of search results in Google Scholar) for each species in the list provided by Ceballos and Ehrlich.
First, I used Tabula to get the data out of the clunky pdf supplement and into a useful format. I was interested in the list of species, the year they were described, and in the number of hits on an academic search engine for each one. From previous experience, Google Scholar tends to index more material and provide more relevant results. Unfortunately, there is no API for Google Scholar, and automated searches and scraping are not allowing in their Terms of Service. While it is technically possible to run automated searches and scrape the results, the search engine will detect and block anything that looks like automatic queries. This means any scraping function will end up having to wait between searches (see here), so I went with the manual approach.
For 361 species picked at random in the dataset, I did manual searches on Google Scholar in a web browser (using quotations to search for exact matches) and gathered the number of search results in a simple table (download link is with the code). I graphed the number of results for each species (grouped by order) below. The data and code for all these figures is at the end of this post. I’m pretty proud of how I integrated dplyr and ggplot2 to wrangle the data and make the figures. Click on any picture to enlarge it.
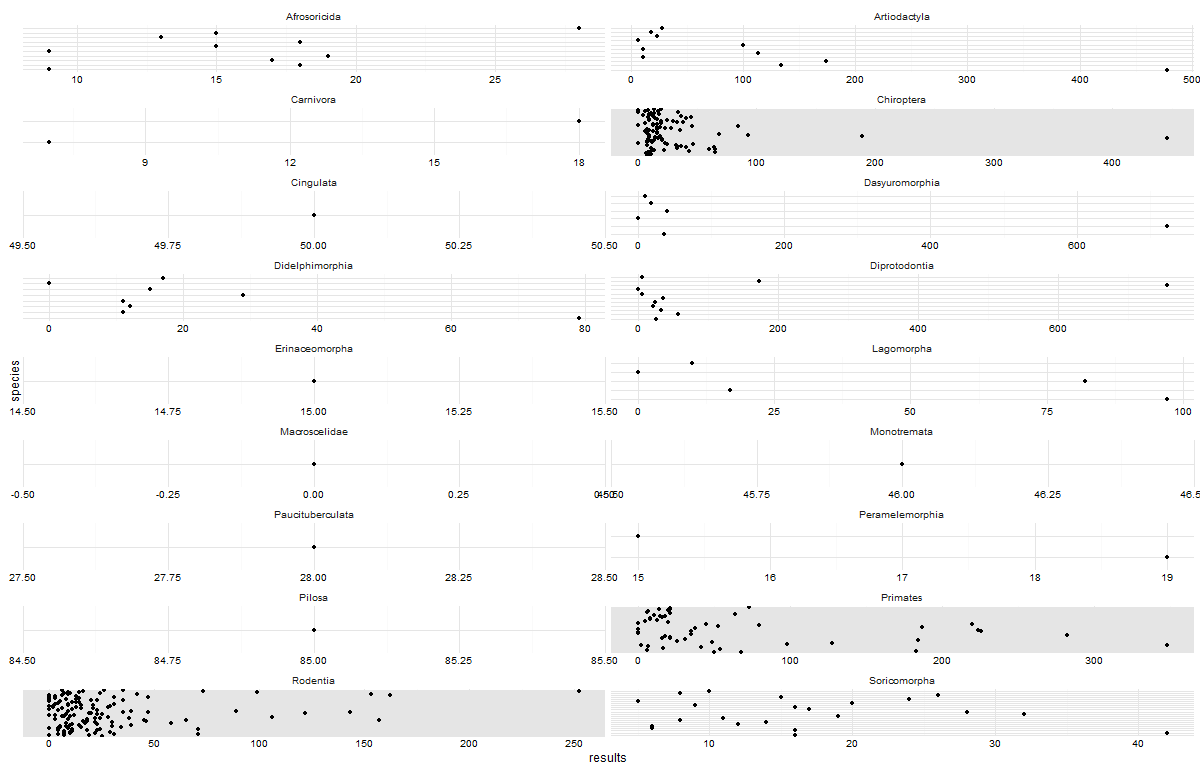
I ordered the species by their year of description, pulled from the reference column in the original pdf supplement using stringr. Species with more recent description dates appear at the top of their respective facets.
# get last four elements of reference vector i.e. description year
library(stringr)
# dummy references
references <- c("Johnson, 2002", "Smith et al., 1999")
# extract last four elements of vector
years <- str_sub(references,-4,-1)
years
Within some orders, it does look as if the species with the earlier description dates appear in more academic literature. Across the entire dataset, there is no visible pattern.
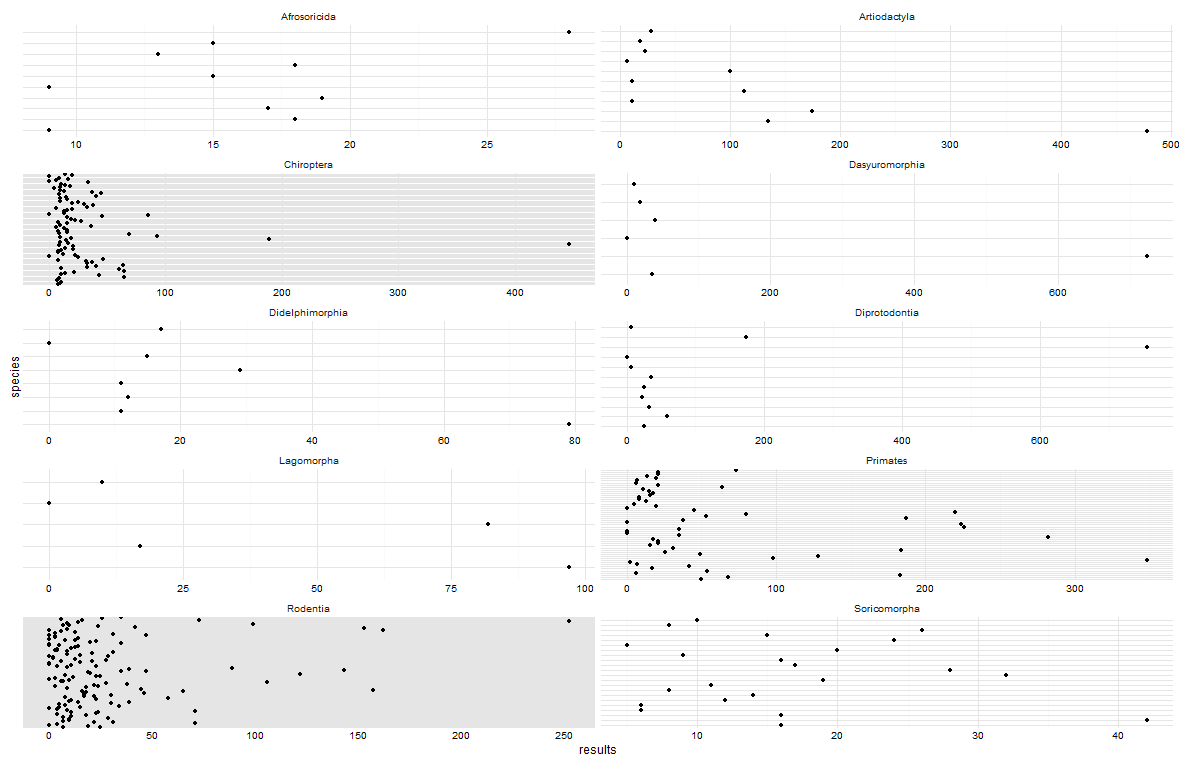
To get a better look at some of the orders that have yielded more new species, here is the same figure for the orders with >2 new species in this dataset.
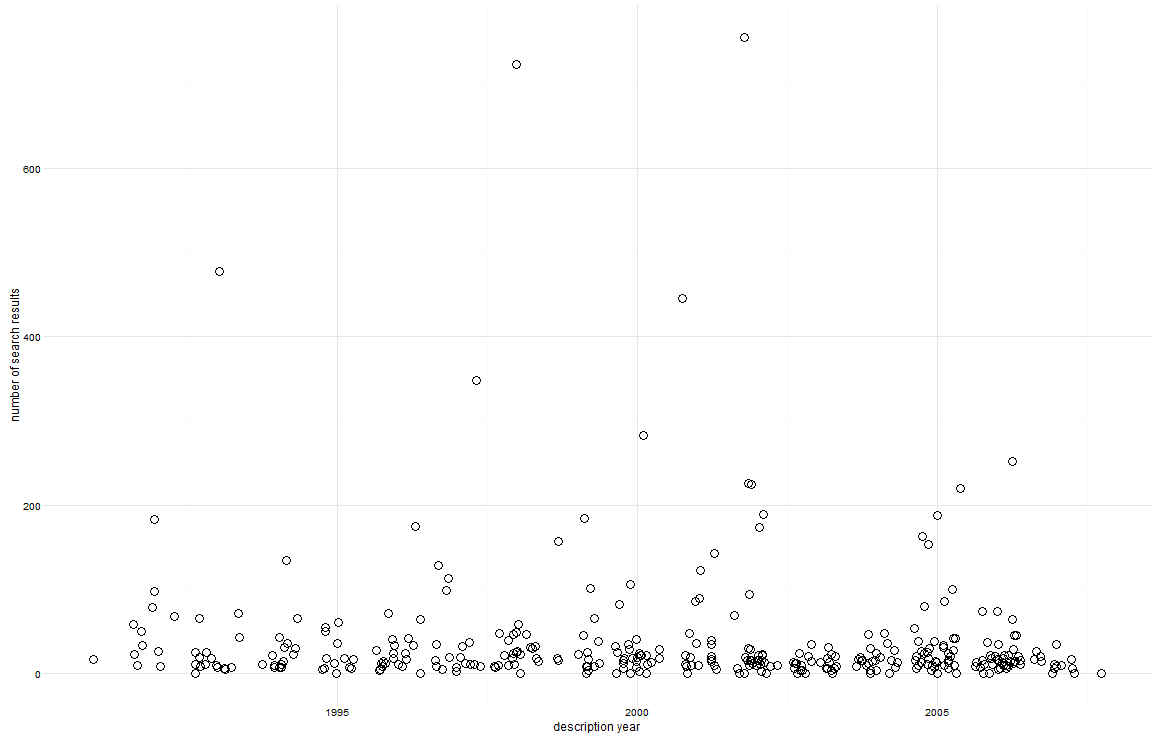
This last plot focuses on the two most diverse orders, which also happen to have the most new species. Go ahead and call me a chartjunking tourist for this one, but I wanted to try out rphylopic at some point. I replaced the points in this dotplot for description dates, and used the gridExtra package to arrange the plots side by side.
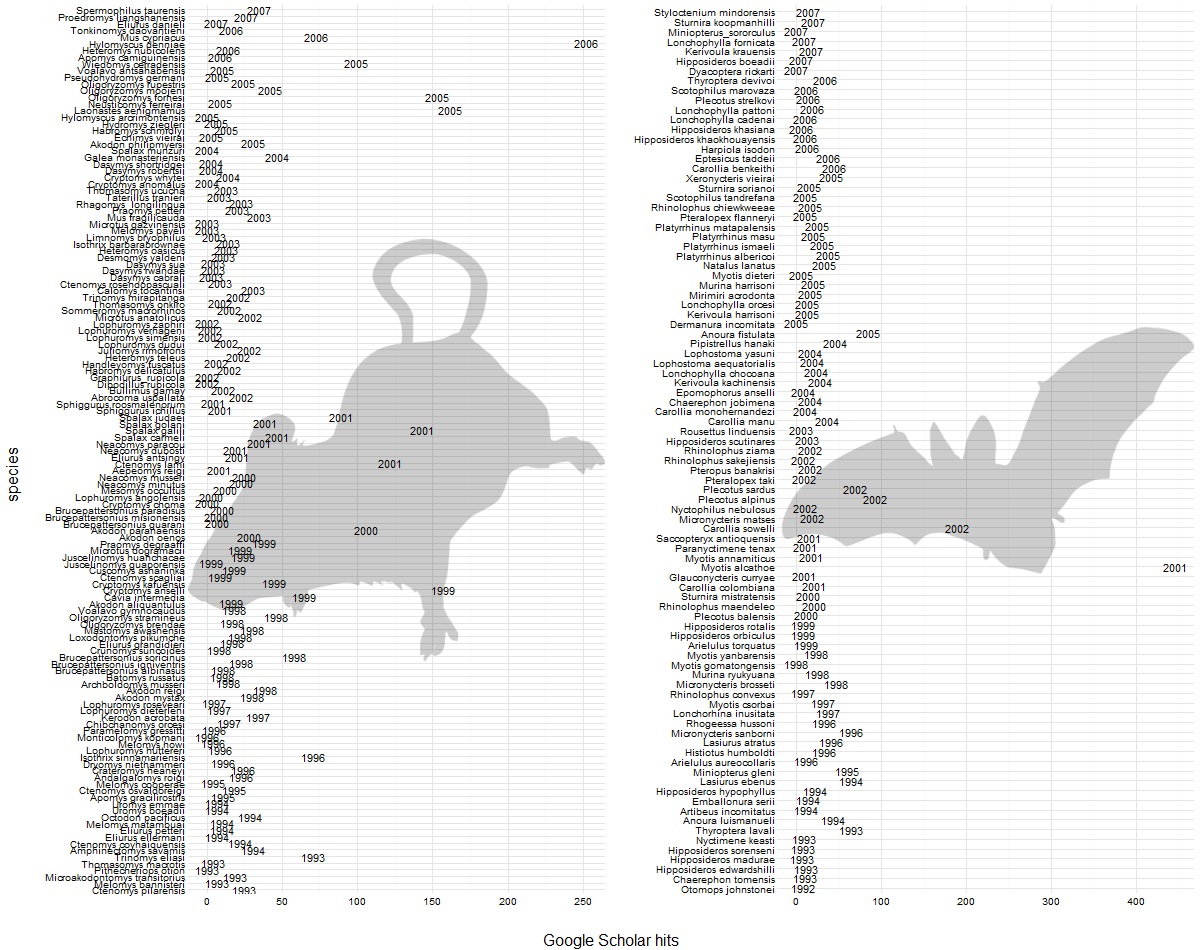
The amount of research effort for new mammal species, as represented by Google Scholar hits, varies widely and does not seem to relate with description date. Some species in this list had no results, and some had hundreds. The average number of results was 37, which is higher than I expected, but reasonable considering that some of these species were described over 20 years ago.
This exercise also shows the importance of what criteria are used for considering a species as ‘new to science.’ For example, mountain brushtail possums were split into two different species in 2002, and the northern form Trichosurus caninus retained the name it had since 1836, which explains its 755 search hits. When I was searching for the species names, I realized that this “search results” metric is very ambiguous, and it can be broken down into different types of literature for a better understanding of what happens after new species are described, for example: what are the paths of these taxa into field guides, textbooks, conservation assessments, identification keys, etc.
As always, contact me with any questions or comments.
- I know Soricomorpha is paraphyletic but I automated the assignment of species into their corresponding orders and the database I chose uses this classification.
#Code and data