
Last year the Mexican Mammalogy Society (Asociación Mexicana de Mastozoología A.C.; AMMAC) celebrated its 30th anniversary. As part of the festivities, an analysis of the work presented at national AMMAC meetings from 1991 to 2012 was published in a special section of the society-run journal Therya. These meetings are perhaps the most important academic forum for mammal research in the country. I’ve attended several of these meetings and always enjoy seeing so many researchers and students present their research on Neotropical mammals, so a quantitative summary of the research trends in Mexico for the last few decades definitely caught my attention. I had never considered the concept of analyzing conference data, and for months I’ve been meaning to write about this particular paper.
Miguel Briones-Salas, Dagoberto Ramos and Yadira Santiago went through the abstract booklets for eleven national mammalogy meetings [Open Access paper here (in Spanish)]. Briones and his team examined 2527 summaries, representing 1596 oral and 931 poster presentations. From these abstracts they were able to determine the most popular research topics and study groups, which states received the most research interest, and the participation of Mexican and international institutions in the conferences.
Study topics
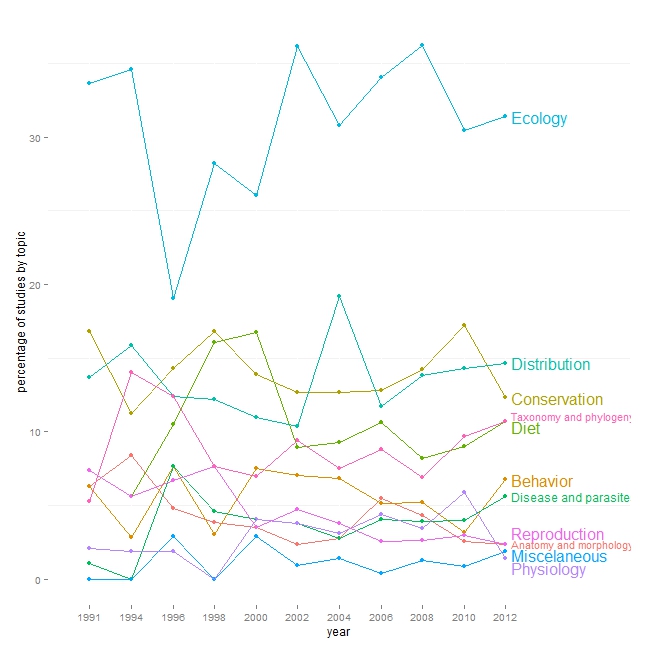
The team classified the presentations into one of eleven main topics, with choices of: diet, anatomy & morphology, behavior, conservation, distribution, ecology, disease & parasites, physiology, reproduction, taxonomy & phylogeny, and miscellaneous. I was a little puzzled as to why diet wasn’t included in “ecology”, but in any case ecology was the predominant topic. I plotted the table of topics through time as proportions, to see which topics were most popular at each conference and through the years.
Here’s the fully reproducible code for this figure. I tried to include some nifty dplyr data manipulation and I stumbled accross the direct.labels package that came in handy for ggplot2 objects. Thanks to @jrosenberg6432and @thosjleeper for the help.
# load packages
library(dplyr)
library(ggplot2)
library(reshape2)
library(directlabels)

# load data from github repo
theryaData <- read.csv("http://raw.githubusercontent.com/luisDVA/codeluis/master/theryaData.csv")

#transform the values to proprotions
theryaData[,2:12] <- theryaData %>% select(-topic,-total) %>%
                      mutate_each(funs(prop = (. / sum(.)*100)))

# this can also be done using the apply family of functions
# data.frame(mapply(`/`, theryaData[,2:12], colSums(theryaData[,2:12]), SIMPLIFY = FALSE))

# melt before plotting
theryaProps <- theryaData %>% select(-total) %>% melt()

# plot as points+lines *I used a default color palette
pointPlot <- ggplot(theryaProps,aes(x=variable,y=value, group=topic))+
                geom_point(aes(color=topic)) + geom_line(aes(color=topic))+
                theme(panel.background = element_blank(),legend.position="none")+
                coord_cartesian(xlim=c(0,14)) +ylab("percentage of studies by topic")+xlab("year")+
                scale_x_discrete(labels=gsub("X","",unique(theryaProps$variable)))

# add labels at end of lines
direct.label(pointPlot,list(dl.trans(x=x+0.2),"last.qp"))
For the entire dataset and within each conference: ecology was the most popular topic, followed by conservation and biogeographical studies – both of which follow similar trends. Taxonomy and phylogenetics studies represent a small percentage of presentations throughout the meetings analysed, and they show a very low increase in representation over the years. I wonder if this is restricted by the funds needed to pay for expensive lab materials, sequencing services or computing resources. To a certain extent, these trends probably reflect the personal interests of the PIs throughout the country along with the popular topics in mammalogy at the time of each meeting. I should also point out that classifying a study with nothing more than its title and abstract is not as straight-forward as it sounds. Ecology might actually be more studied, or more studies were classified as ecological in nature when they may have belonged in a different category.
Participation
The study found a promising pattern of increasing participation in the society’s meetings through time, and growing representation for institutions and states that were absent from the first few conferences. Unsurprisingly, the big universities in the capital (Mexico City) are the predominant source of presenters at these meetings, and 97% of authors were from Mexican institutions, with the remaining 3% coming from overseas (US and Latin America).
Taxonomy
The taxonomic distribution of studies showed a nice mix of large-bodied, “charismatic” groups with other equally important orders of small mammals. Five orders received most of research interest. Carnivores were the most studied group (24.8%), followed very closely by rodents (24.3%), then bats (19.4%), even-toed ungulates (12%) and lagomorphs (6%). Primate studies seem particularly low in this regard (3%), and I suspect primatology research groups may be choosing to present their research at specialized primatology/anthropology meetings.
Conference vs. literature
The authors mention another study (Guevara-Chumacero et al., 2001; OA link [here, in Spanish]) that documented mammal research in Mexico from 1890 to 1995, using peer-reviewed articles and books as their data sources. This paper from 2001 found that roughly 80% of the literature on Mexican mammals was written by non-Mexicans authors, published in non-Mexican journals, and focused mostly on taxonomy and systematics. Given the time period considered, I don’t find this statistic surprising and I suspect that research trends from 1995-present in the published literature are similar. Now I’m curious to see what are trends for the main topics and study groups presented at conferences organized by other mammalogy societies, for example: the Australian Mammal Society or the American Society of Mammalogists.
The bias between conference communications and publications also made me wonder about the overlap between what is presented at conferences with what is published in peer-reviewed literature, and especially the publication status of conference communications. What are the publication rates of research presented in different countries, topics, or for different types of conferences (e.g. national specialist meetings vs. massive international conferences)? In my next post I’ll elaborate on this topic, and discuss the conference to publication pipeline for my particular field.