Drawing polygons around groups of points in ggplot
Updated on February 2020 to include geoms provided by
ggforce.
Esta publicación está disponible en español aqui
For various kinds of analyses, we often end up plotting point data in two dimensions for two or groups. This includes Principal Component Analyses, bioclimatic profiles, or any other combination of values on two axes. Here are some alternatives for drawing polygons around groups of points, with code and examples.
These methods are for ggplot, but I assume there are ways to do the same things using base or other plotting engines. I wanted to use real data, so the following examples use data from this paper on the physiology of the Japanese quail. After loading (or installing if necessary) the required packages and downloading the data from Dryad, we can wrangle the data so we can plot length and mass data from several individual birds at 30 vs 40 days of age.
# load packages (install first if needed)
library(dplyr)
library(ggplot2)
library(ggalt)
library(ggforce)
# load data downloaded from repository (from your own working directory)
birdData <- read.csv("Morphology data.csv",stringsAsFactors = FALSE)
# split into DFs for 30 and 40 days of age
birds40 <- birdData %>% select(mass=Day.40.mass..g.,length=Day.40.head.bill.length..mm.) %>% mutate(age="day40")
birds30 <- birdData %>% select(mass=Day.30.mass..g.,length=Day.30.head.bill.length..mm.) %>% mutate(age="day30")
# bind and remove rows with missing data
birdsAll <- bind_rows(birds30,birds40) %>% na.omit()

# plot points only
ggplot(birdsAll,aes(x=mass,y=length,color=age))+geom_point()+theme_bw()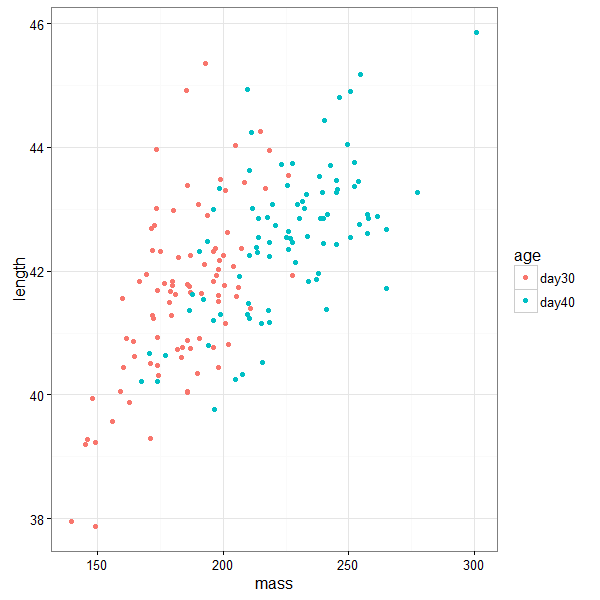
Convex hulls
Convex hulls are one of the most common methods for grouping points. Convex hulls have a formal geometric definition, but basically they are like stretching a rubber band around the outermost points in the group. We can now calculate the convex hulls for many groups using ggforce.
# calculating convex hulls
#plot with hull
ggplot(birdsAll,aes(x=mass,y=length))+
  geom_mark_hull(concavity = 5,expand=0,radius=0,aes(fill=age))+
  geom_point()+
  theme_bw()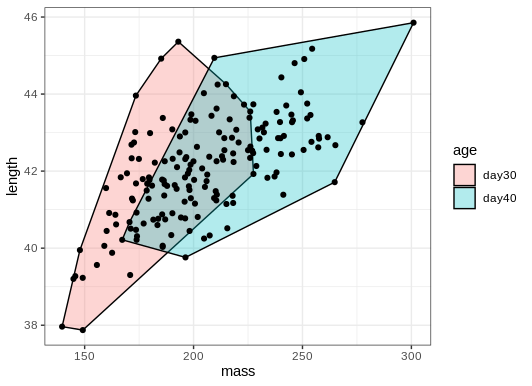
Convex hulls often include large areas with no points in them. Tweaking the parameters can give us a tighter hull with nice round corners.
# rounded and more concave hull
ggplot(birdsAll,aes(x=mass,y=length))+
  geom_mark_hull(expand=0.01,aes(fill=age))+
  geom_point()+
  theme_bw()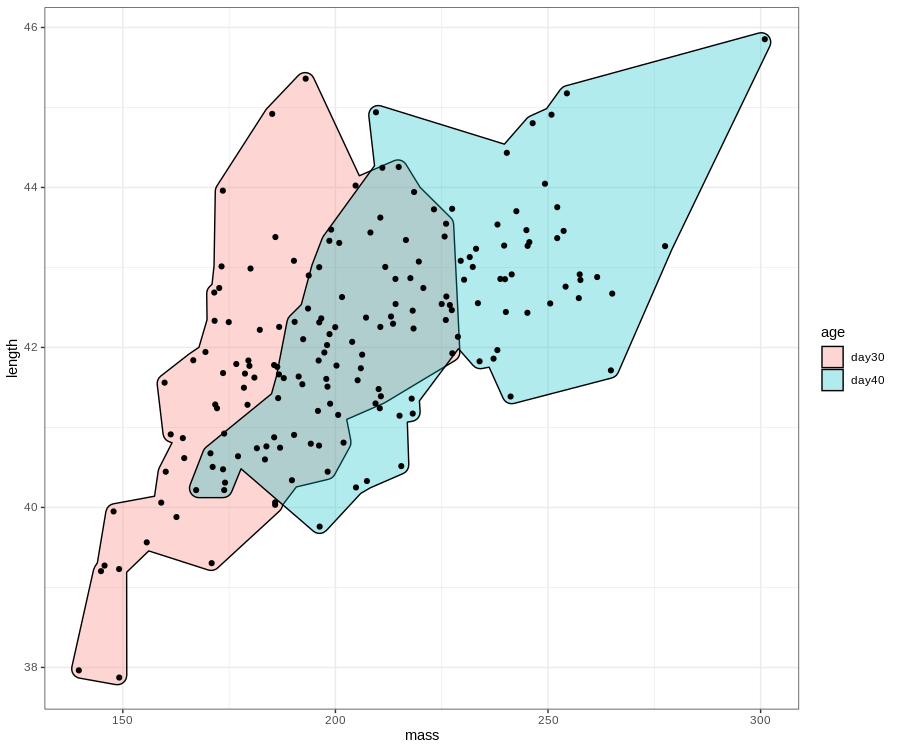
Ellipses
Another common alternative is to group points using ellipses. We can plot the ellpises with ggforce, although ggplot::stat_ellipse is also an option.
# plot with ellipse
ggplot(birdsAll,aes(x=mass,y=length))+
  geom_mark_ellipse(expand = 0,aes(fill=age))+
  geom_point()+
  theme_bw()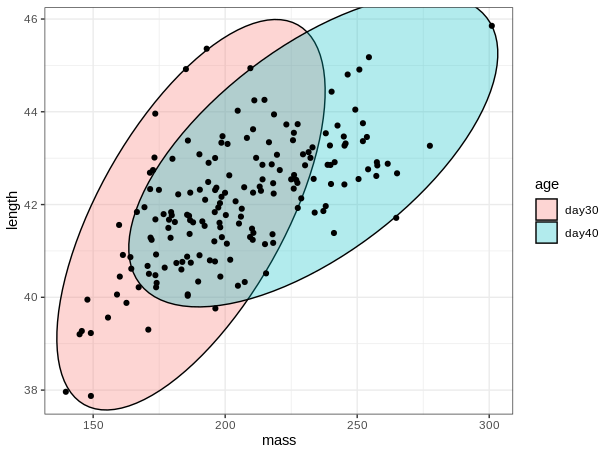
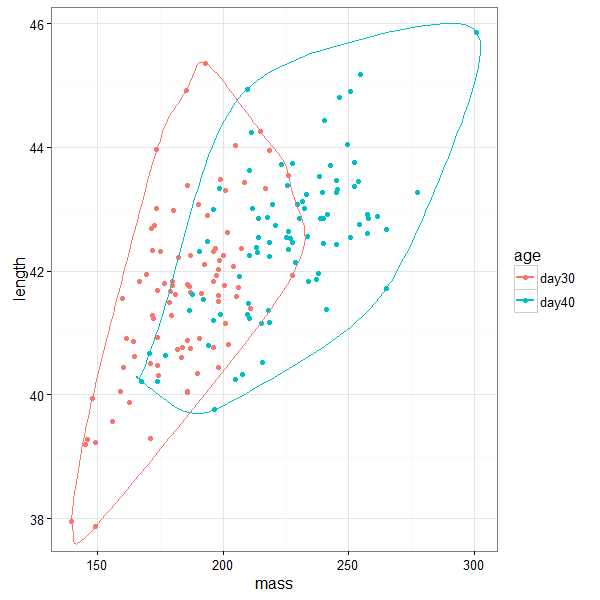
Encircle
This option is what I ended up using for my own figures. It usesgeom_encircle, a new geometry provided in the ggalt package. This geom uses polynomial splines to draw nice smoothed polygons around the groups of points. It has flexible options for color, fill, and the smoothness of the polygons that it draws. This method is nice for highlighting groups visually and indicate cohesion, and not necessarily for performing any further analyses on the polygons themselves (e.g. using the areas or the amount of overlap for other subsequent tests).
# plot with spline encirclement
  ggplot(birdsAll,aes(x=mass,y=length,color=age))+geom_point()+
          geom_encircle(expand=0)+ theme_bw()
We can change the transparency and fill values of the different polygons for all the methods. This can be useful to highlight overlap between groups.
Hope this helps. LD